Alerting
On the Alerting screen, you can configure alerts for user-defined conditions that could indicate cluster issues.
You can use one of the available numeric metrics to specify the condition. For example, you can specify a condition for sustained high CPU load or excessive disk usage on nodes. If a condition lasts for the specified time, GridGain Nebula sends a notification via email, SMS, or webhook.
Each alert can have multiple channels assigned.
Predefined Alerts
When a GridGain 8 cluster is attached, the GridGain Nebula automatically creates a set of predefined alert configurations. They appear on the Alerting screen as Predefined.
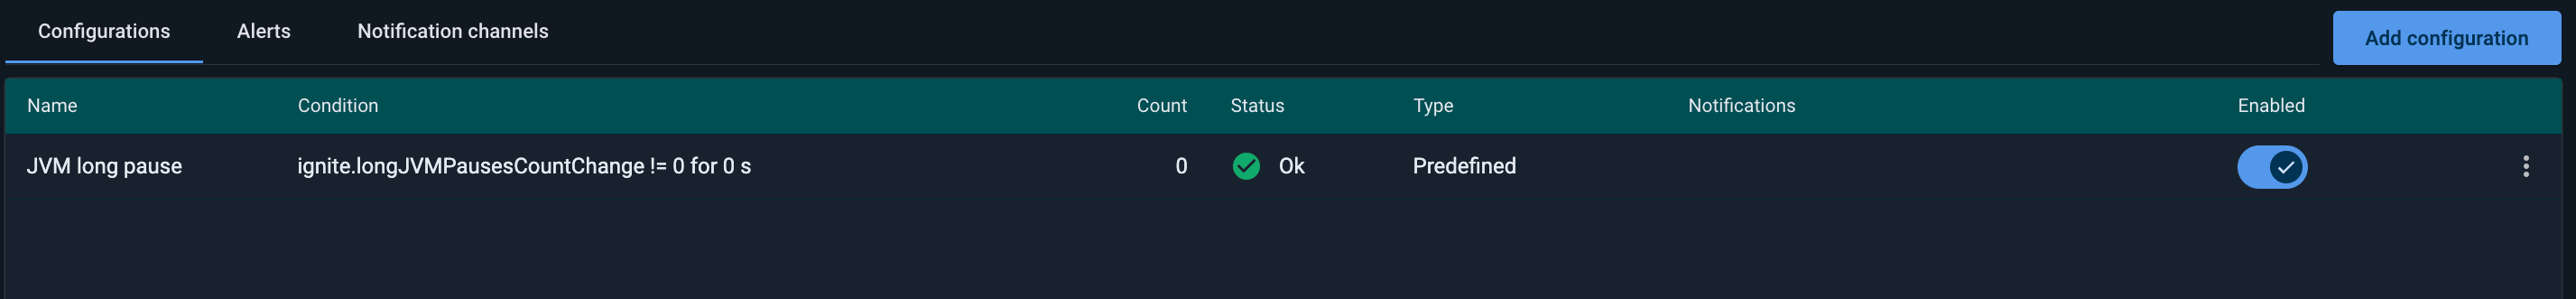
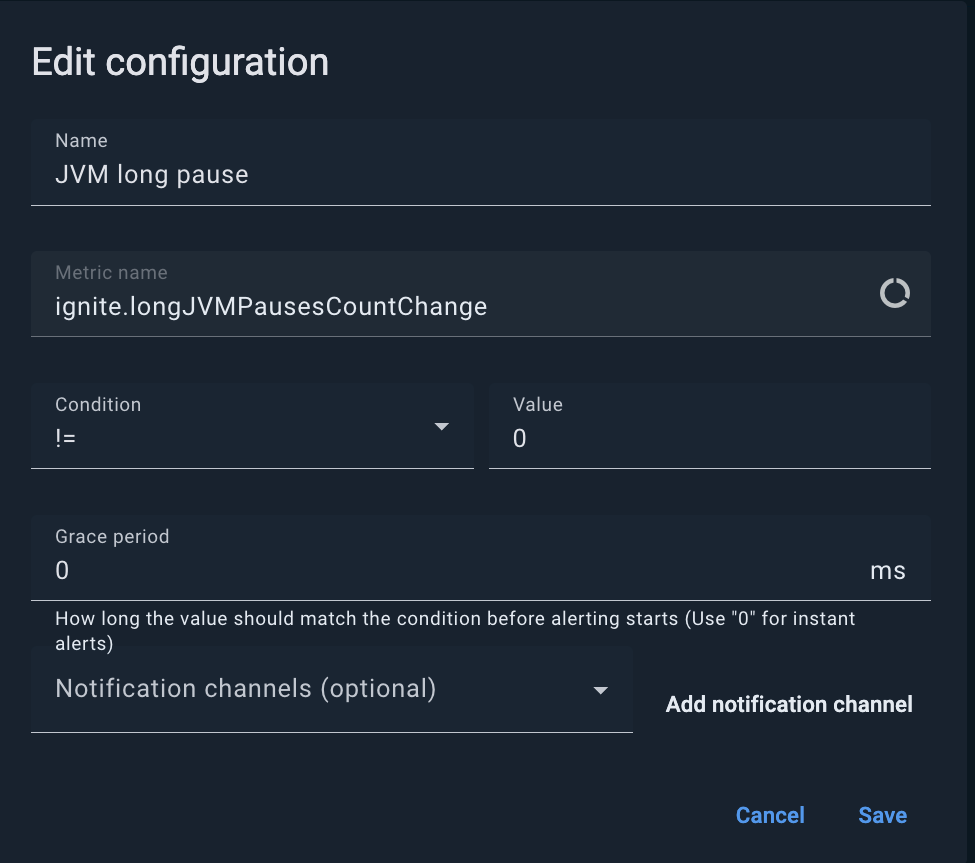
You can modify the name and threshold values of a predefined alert or delete the alert completely. However, you cannot change the underlying metric itself.
Creating Alerts
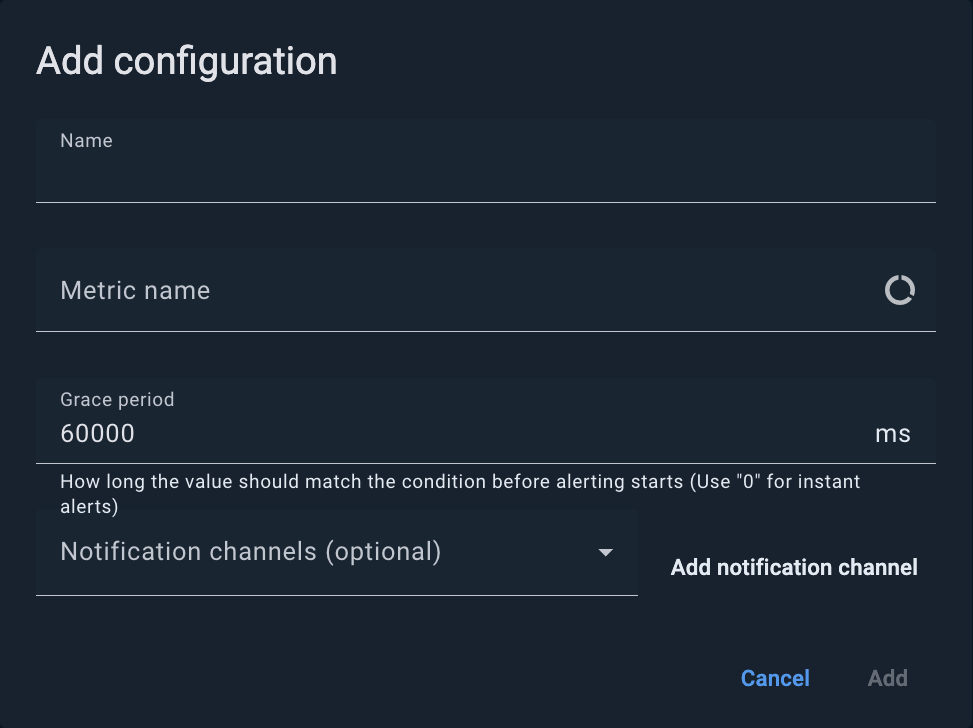
On the CONFIGURATIONS tab, click the ADD ALERT button and fill out the fields of the dialog box that appears.
| Field | Description |
|---|---|
Name |
The name of the alert |
Metric name |
The metric that you want to monitor |
Condition |
The condition to be met |
Value |
The value to which the metric is to be compared |
Grace Period |
The amount of time that the condition can exist before an alert is generated.
The grace period prevents occasional spikes from triggering alerts.
A setting of |
Notification Channels |
The notification channels that are associated with the alert. To create a notification channel, click ADD NOTIFICATION CHANNEL. |
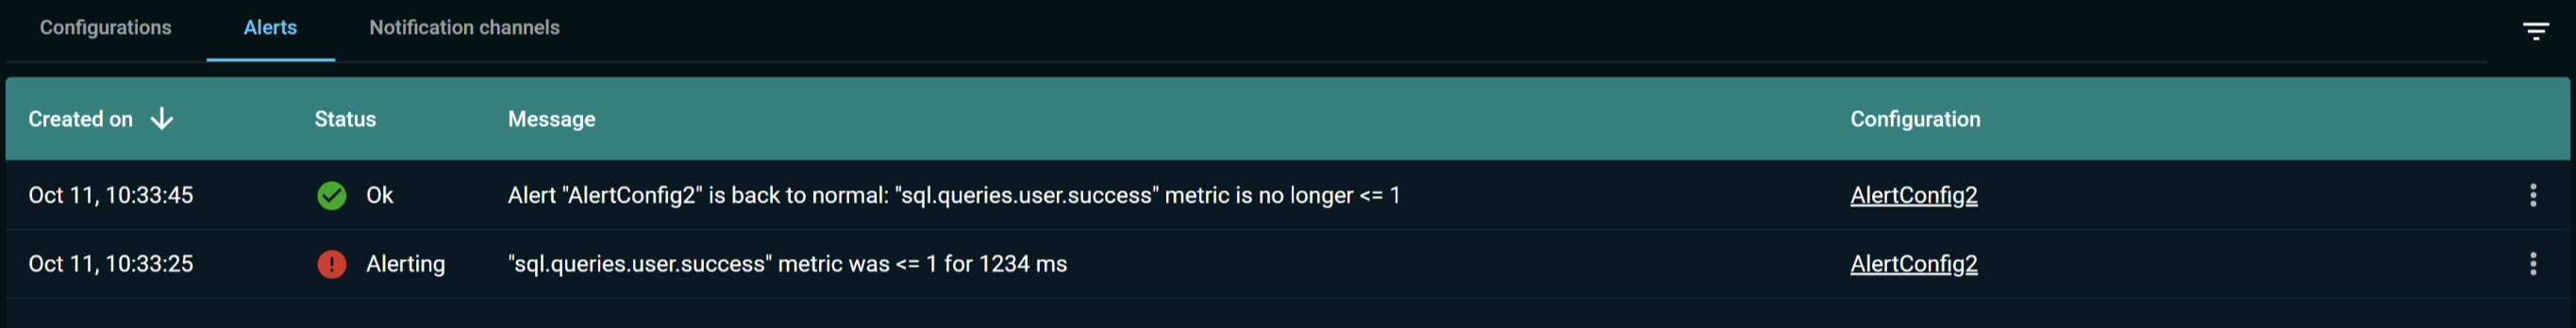
Viewing Alert History
The Alerts tab displays the alert history.
| Column | Description |
|---|---|
Created On |
The time when the alert was generated. |
Status |
The status of the alert:
|
Message |
The alert message. |
Configuration |
The configuration of the alert. |
The Filter section, on the right, enables you to filter the alert list by configuration, status, and the creation period.
Creating Notification Channels
To create a notification channel:
-
Go to the NOTIFICATION CHANNELS tab and click ADD NOTIFICATION CHANNEL.
-
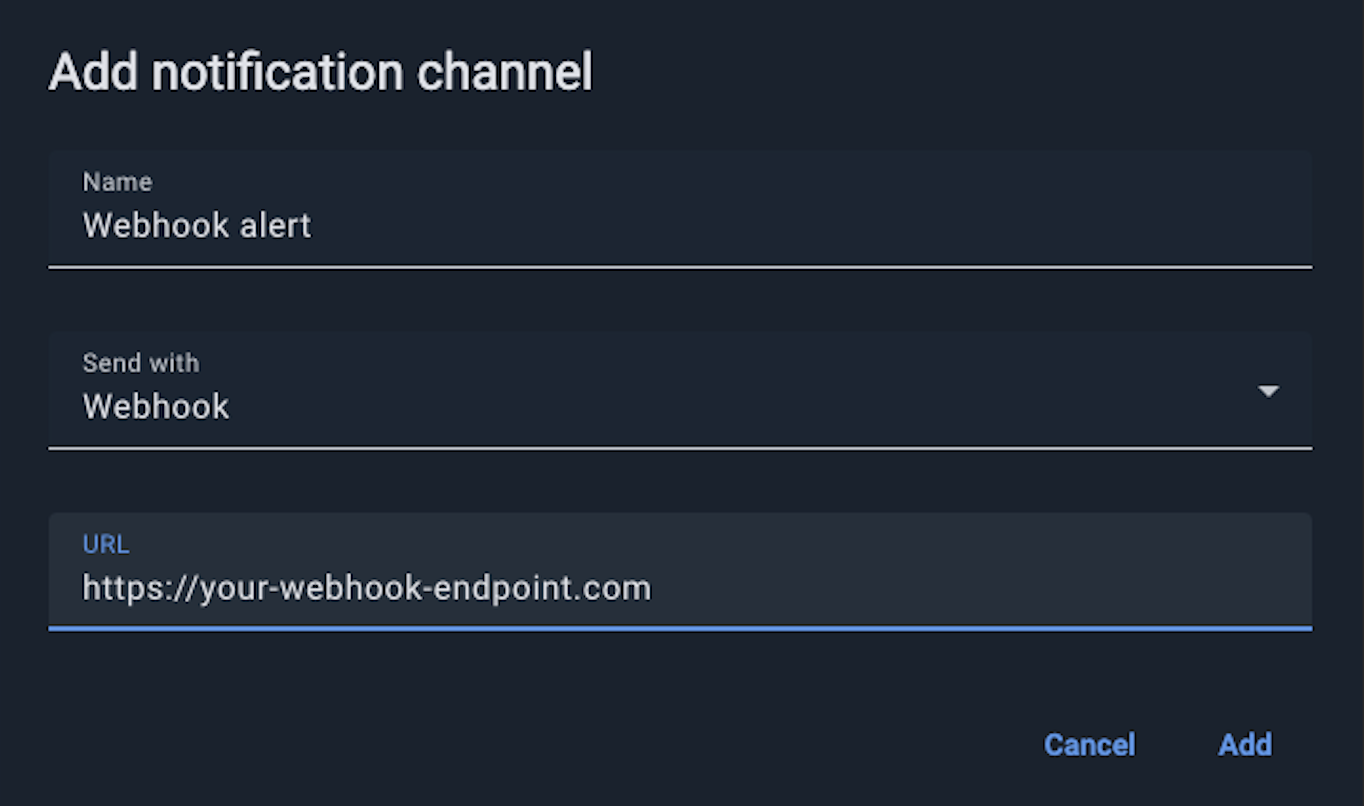
Enter the name of the notification channel.
-
In the Send with field, select Email, SMS or Webhook.
-
In the Send to field, enter an email address or a phone number. If Webhook option is selected, provide the URL of the endpoint that accepts alerts.
Configure Webhook Notifications
When an alert is triggered, GridGain Nebula sends a POST request to the configured webhook URL with the following JSON payload:
| Column | Description |
|---|---|
eventType |
Event type. Always is |
alertId |
ID of the triggered alert. |
alertName |
Alert name as configured in Nebula (e.g. |
clusterId |
ID of the cluster that triggered the alert. |
clusterTag |
Cluster name (for GridGain 9 clusters) or cluster tag (for GridGain 8) associated with the cluster (e.g. |
state |
Current state of the alert. Possible values:
|
message |
Alert message describing the condition that caused it (e.g. |
timestamp |
Time the alert was triggered, in milliseconds. |
controlCenterUrl |
URL of the GridGain Nebula instance that sent an alert. |
Below is a sample JSON sent by the GridGain Nebula when an alert is triggered:
{
  "eventType": "CONTROL_CENTER_ALERT",
  "alertId": "123e4567-e89b-12d3-a456-426614174000",
  "alertName": "High CPU Usage",
  "clusterId": "987fcdeb-51a2-43d7-b123-456789abcdef",
  "clusterTag": "production-cluster",
  "state": "ALERTING",
  "message": "CPU usage has exceeded 80% threshold",
  "timestamp": 1704067200000,
  "controlCenterUrl": "https://portal.gridgain.com"
}
© 2026 GridGain Systems, Inc. All Rights Reserved. Privacy Policy | Legal Notices. GridGain® is a registered trademark of GridGain Systems, Inc.
Apache, Apache Ignite, the Apache feather and the Apache Ignite logo are either registered trademarks or trademarks of The Apache Software Foundation.