
Introduction
The Spark SQL engine provides structured streaming data processing. The benefit here is that users can implement scalable and fault-tolerant data stream processing between the initial data source and final data sync.
You can read more about it here:
https://spark.apache.org/docs/latest/structured-streaming-programming-guide.html
Apache Ignite provides the Ignite SQL engine, which includes advanced indexing and strong processing APIs for computing on distributed data. In other words, Apache Ignite can be used as an accelerator for data processing.
We can use the Apache Ignite Spark DataFrame API for integration with Spark as well. Future articles will describe how this should be configured:
- https://apacheignite-fs.readme.io/docs/ignite-data-frame
- https://www.gridgain.com/resources/blog/apacher-ignitetm-and-apacher-sparktm-integration-using-ignite-dataframes
This article is about how to debug the loading of the data from a Spark source to Apache Ignite for future processing.
Spark provides these instruments for debugging of your application:
- Execution plans
- Spark cluster and executor UI
- Additional logging
The information below will also provide a high-level overview about how and where users can get details about data loading to Apache Ignite using ignite-spark integration.
Configuration
As mentioned above, configuration will not be fully described in the current article. We will use simple data loading from a CSV file into Apache Ignite. Below you can see the Spark and Ignite versions used in current example:
Item |
Version |
Ignite |
2.7.5 |
Spark |
2.3.0 |
Our example will use the “Person” cache data. Here is the cache configuration that should be added to your Apache Ignite server XML:
Person cache
<property name="cacheConfiguration">
<list>
<bean class="org.apache.ignite.configuration.CacheConfiguration">
<property name="name" value="Person" />
<property name="cacheMode" value="PARTITIONED" />
<property name="atomicityMode" value="ATOMIC" />
<property name="sqlSchema" value="PUBLIC" />
<property name="queryEntities">
            <list>
               <bean class="org.apache.ignite.cache.QueryEntity">
                  <property name="keyType" value="PersonKey" />
                  <property name="valueType" value="PersonValue" />
                  <property name="tableName" value="Person" />
                  <property name="keyFields">
                     <list>
                        <value>id</value>
                        <value>city_id</value>
                     </list>
                  </property>
                  <property name="fields">
                     <map>
                        <entry key="id" value="java.lang.Integer" />
                        <entry key="city_id" value="java.lang.Integer" />
                        <entry key="name" value="java.lang.String" />
                        <entry key="age" value="java.lang.Integer" />
                        <entry key="company" value="java.lang.String" />
                     </map>
                  </property>
                  <property name="aliases">
                     <map>
                        <entry key="id" value="id" />
                        <entry key="city_id" value="city_id" />
                        <entry key="name" value="name" />
                        <entry key="age" value="age" />
                        <entry key="company" value="company" />
                     </map>
                  </property>
               </bean>
            </list>
         </property>
      </bean>
   </list>
</property>
To get more information about the configuration of the caches in Apache Ignite, please use the following link: https://apacheignite.readme.io/docs/cache-configuration
Example code for data loading to Ignite via data frames:
Data frame code sample
String configPath = "client.xml";

SparkConf sparkConf = new SparkConf()
 .setAppName("Example");

SparkSession session = SparkSession.builder()
 .config(sparkConf)
 .getOrCreate();

Dataset < Row > csvDataset = session.read()
 .format("csv")
 .option("sep", ",")
 .option("header", true)
 .load("person.csv");

Dataset < Row > resultDF = csvDataset
 .select("id", "name", "city_id", "company")
 .sort("id")
 .limit(10000);

for (int i = 0; i < 10; i++) {
 DataFrameWriter < Row > df = resultDF
  .write()
  .format(IgniteDataFrameSettings.FORMAT_IGNITE())
  .option(IgniteDataFrameSettings.OPTION_CONFIG_FILE(), configPath)
  .option(IgniteDataFrameSettings.OPTION_TABLE(), "Person")
  .option(IgniteDataFrameSettings.OPTION_CREATE_TABLE_PRIMARY_KEY_FIELDS(), "id, city_id")
  .option(IgniteDataFrameSettings.OPTION_CREATE_TABLE_PARAMETERS(), "template=partitioned,backups=1")
  .mode(Append);

 df.save();
}

session.close();
This code will perform the following logic:
- Load 5 mln rows of data from the disk
- Filter the data
- Sort the data set
- Save first 10000 entries into Ignite ten times
Spark submits script:
#!/bin/sh

# build all other dependent jars in EXECUTOR_PATH

LIBS_DIR=$1
EXAMPLE_CLASS=$2
PATH_TO_JAR=$3
JARS=`find $LIBS_DIR -name '*.jar'`
EXECUTOR_PATH=""
   for eachjarinlib in $JARS ; do
if [ "$eachjarinlib" != "ABCDEFGHIJKLMNOPQRSTUVWXYZ.JAR" ]; then
       EXECUTOR_PATH=file:$eachjarinlib:$EXECUTOR_PATH
fi
done
spark-submit --deploy-mode client --master spark://172.25.4.69:7077 --conf "spark.driver.extraClassPath=$EXECUTOR_PATH" --conf "spark.executor.extraClassPath=$EXECUTOR_PATH" --class $EXAMPLE_CLASS $PATH_TO_JAR $4 $5 $6 $7
In the current example, we started local Spark master and slave nodes. The next command can be used for running the code:
Run command
bash ./run_example.sh /home/user/libs/ org.ignite.examples.SparkExample /home/user/spark-example-1.0.0-SNAPSHOT.jar
Spark issues that we are going to debug during writing to Ignite
Our writing task is pretty simple, but issues that may be of interest to us include:
- What exactly does this job do during writing?
- How do we determine the entire writing job execution time?
- How much time was spent on reading data from the disk and on writing data to Ignite?
- Can we optimize this job?
What exactly does this job do during writing?
When you run a Spark job, generally you can see the logic of execution in the main function. You can see that Spark will open the CSV file, do some operation with the data, and save the result. But this is only half the story. You can see the full execution plan only in “explain” output for all pipelines. Let’s add the following code to our example:
Explain code sample
...

Dataset < Row > resultDF = csvDataset
 .select("id", "name", "city_id", "company")
 .sort("id")
 .limit(10000);

resultDF.explain(true);

...
When you execute the job, you will find the following in the output:
Explain output
== Parsed Logical Plan ==
GlobalLimit 10000
+- LocalLimit 10000
   +- AnalysisBarrier
         +- Sort [id#10 ASC NULLS FIRST], true
            +- Project [id#10, name#12, city_id#11, company#14]
               +- Relation[ID#10,CITY_ID#11,NAME#12,AGE#13,COMPANY#14] csv

== Analyzed Logical Plan ==
id: string, name: string, city_id: string, company: string
GlobalLimit 10000
+- LocalLimit 10000
   +- Sort [id#10 ASC NULLS FIRST], true
      +- Project [id#10, name#12, city_id#11, company#14]
         +- Relation[ID#10,CITY_ID#11,NAME#12,AGE#13,COMPANY#14] csv

== Optimized Logical Plan ==
GlobalLimit 10000
+- LocalLimit 10000
   +- Sort [id#10 ASC NULLS FIRST], true
      +- Project [id#10, name#12, city_id#11, company#14]
         +- Relation[ID#10,CITY_ID#11,NAME#12,AGE#13,COMPANY#14] csv

== Physical Plan ==
TakeOrderedAndProject(limit=10000, orderBy=[id#10 ASC NULLS FIRST], output=[id#10,name#12,city_id#11,company#14])
+- *(1) Project [id#10, name#12, city_id#11, company#14]
   +- *(1) FileScan csv [ID#10,CITY_ID#11,NAME#12,COMPANY#14] Batched: false, Format: CSV, Location: InMemoryFileIndex[file:..., PartitionFilters: [], PushedFilters: [], ReadSchema: struct<ID:string,CITY_ID:string,NAME:string,COMPANY:string>
The physical plan is the only one that is really interesting for us. It shows how this job was executed. You should read it from the bottom up. The current physical plan follows:
- Data was read from a CSV file on the disk (FileScan csv).
- Only the fields “id”, “name”, “city_id”, and “company” were used for relation representing (Project [id#10, name#12, city_id#11, company#14]).
- Sort and take the limit 10000 before storing to Ignite (TakeOrderedAndProject(limit=10000, orderBy=[id#10 ASC NULLS FIRST], output=[id#10,name#12,city_id#11,company#14])).
So this looks very simple to read.
How do we determine the entire writing job execution time?
This should be easy too: just get the time at the beginning of the main function and at the end. This can work, but generally Spark sends this job to different Spark executors, and every executor can run the job with different times. So it would be great to see, for example, all the jobs that work fast and the one that works very slowly. To get this information, let’s go to Spark cluster UI. By default, it will be started on port 8080.
Spark Cluster UI
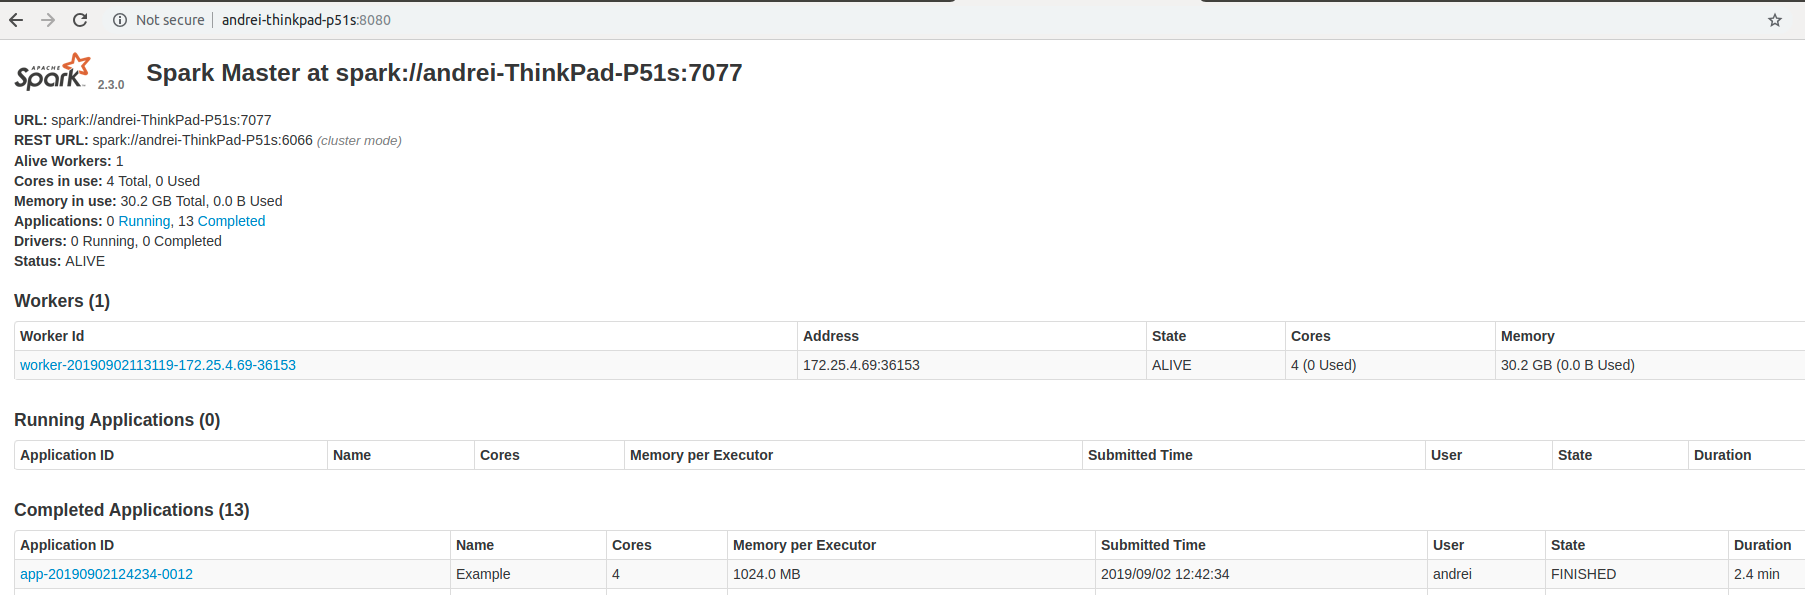
Here you can find the completed applications. The following information can be gotten from this screen:
Item |
Value |
Application name |
Example |
Used cores |
4 |
Memory per executor |
1GB |
Duration |
2.4 min |
Now we have the total duration of the job. But it looks like we can’t use this information because we don’t know how much time was spent on reading data from the disk and how much time was spent on writing data to Ignite.
How much time was spent on reading data from the disk?
The information about the completed application that we can see in Cluster UI exists only in an aggregated view, and more interesting details can be gotten from the worker UI during execution of the Spark job. We can add a pause to the end of our application as follows:
Pause code sample
…

try {
    Thread.sleep(1000_000_000);
} catch (InterruptedException e) {
    e.printStackTrace();
}

session.close();
Start the job one more time and open the worker UI. By default, it will be started on port 4040. Here is the “Jobs” tab from worker UI:
Worker UI job tab
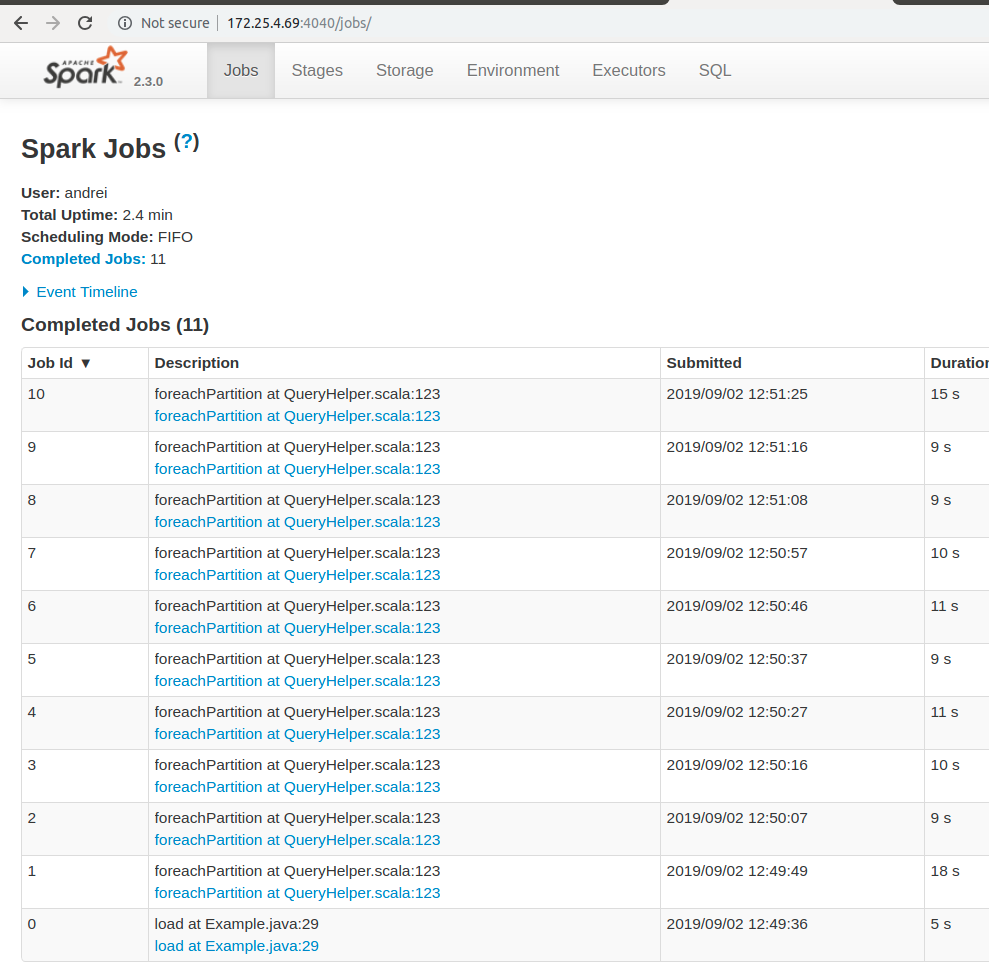
From the Spark worker UI, we see that 11 jobs were done here. What we can see from here:
- 5 seconds were spent on reading the data.
- 18 seconds were spent on the first writing to Ignite.
- 9-10 seconds were spent on next writing to Ignite.
The first writing took more time because we also started the Ignite client node there.
If we open the foreachPartition job, we can see next stage:
Worker UI job stages
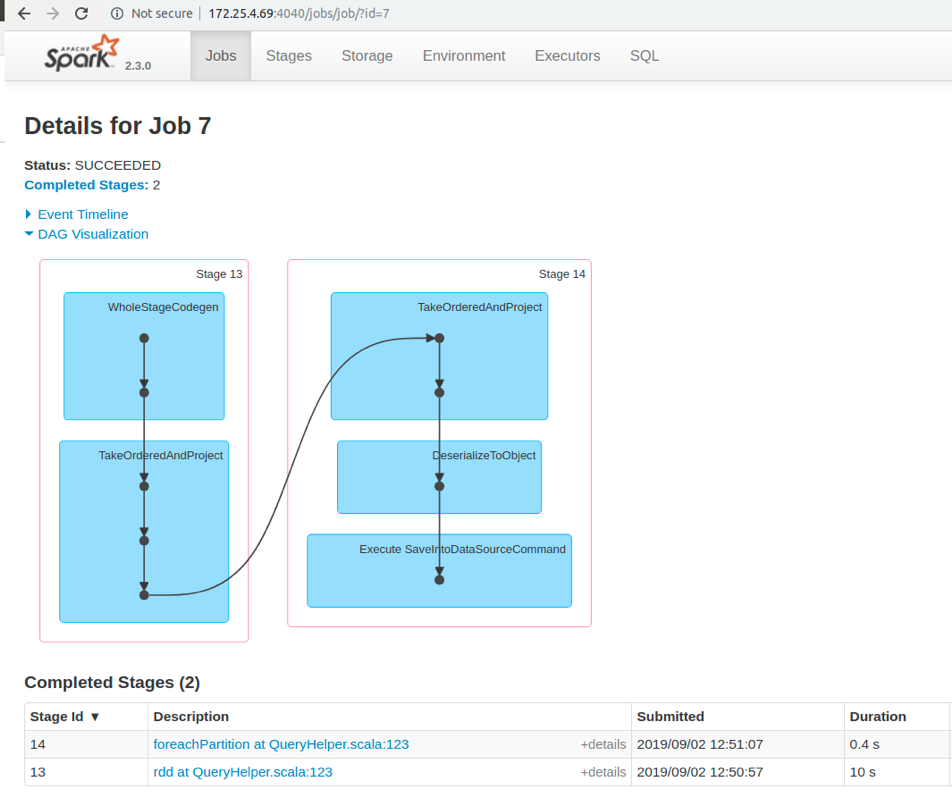
Here we have only two stages for writing to Ignite. However, it’s not the full story:
- load task doesn’t really load the data from the CSV file because Spark just loads some metadata and creates the InMemoryFileIndex for future reading.
- rdd task also contains the reading from the disk.
Sometimes you may see that the rdd stage doesn’t exist. The reason we can’t see it is related to Spark optimizations. Most likely, you don’t have a shuffling operation in your example, such as:
- sorting
- repartition
- limit
Repartition can be a pretty lightweight operation for Spark. If you don’t see the rdd stage, then just try adding the following code into your example:
Repartition code sample
...
    Dataset<Row> resultDF2 = csvDataset
            .select("id", "name", "city_id", "company");

    Dataset<Row> resultDF = resultDF2.repartition(200);
...
Here, 200 is the default value. So in this case, we will do nothing, but let's take a look at the Spark worker UI in the foreachPartition job one more time. Now you should see the rdd stage as it was shown above.
Our foreachPartition job contains two stages instead of one:
- foreachPartition job contains only writing to Ignite now.
- rdd job contains time for reading from the disk and manipulating the data.
Here are all stages that were done during our application (“Stages” tab from Spark worker UI):
Worker UI stages tab
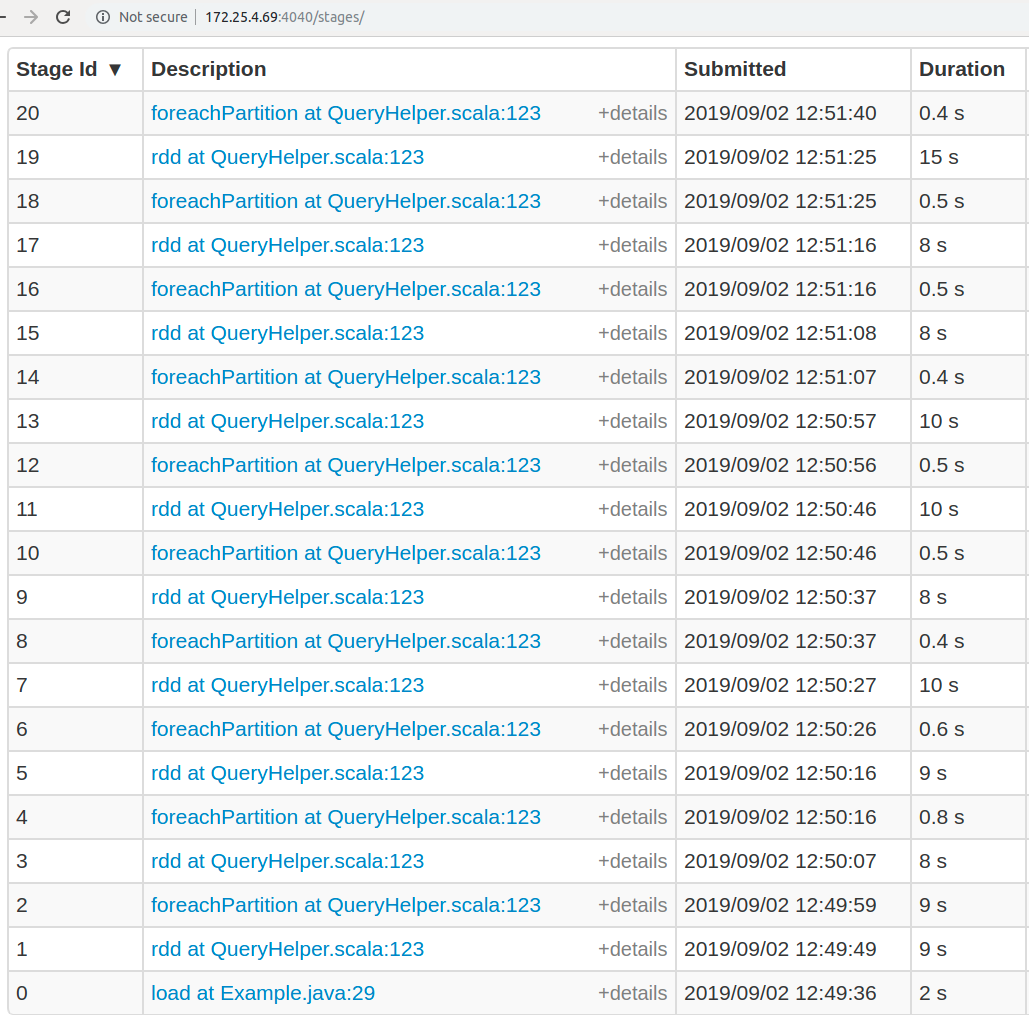
So taking into account the new results, let’s calculate our earlier expectation about timings and the new one:
Item |
Initial expectations |
Real timings |
Reading from the disk and data preparation |
load task - 5 sec total - 5 sec |
load task - 2 sec rdd 9+8+9+10+8+10+10+8+8+15= 95 |
Writing to Ignite |
foreachPartition 18+9+10+11+9+11+10+9+9+15= 111 sec total - 116 sec |
foreachPartition 9+0.8+0.6+0.4+0.5+0.5+0.4+0.5+0.5+0.4 total - 13.6 sec |
We can see that our expectation was incorrect. The difference is significant.
The main question here is why was data read from the disk 10 times? It’s because we didn’t use Spark caching. Let’s add the following code to our example:
Caching code sample
...

Dataset < Row > resultDF = csvDataset
 .select("id", "name", "city_id", "company")
 .sort("id")
 .limit(10000);

resultDF.explain(true);

resultDF.persist(StorageLevel.MEMORY_ONLY());
resultDF.count();

for (int i = 0; i < 10; i++) {
 DataFrameWriter < Row > df = resultDF
  .write()
  .format(IgniteDataFrameSettings.FORMAT_IGNITE())
  .option(IgniteDataFrameSettings.OPTION_CONFIG_FILE(), configPath)
  .option(IgniteDataFrameSettings.OPTION_TABLE(), "Person")
  .option(IgniteDataFrameSettings.OPTION_CREATE_TABLE_PRIMARY_KEY_FIELDS(), "id, city_id")
  .option(IgniteDataFrameSettings.OPTION_CREATE_TABLE_PARAMETERS(), "template=partitioned,backups=1")
  .mode(Append);

 df.save();
}

...
Here you can see two new methods:
- persist method just describes that data for the current data frame should be stored in memory during the next operation, which will make a checkpoint in the data frame pipeline.
- count method is one of the possible operations that can do a checkpoint. Other checkpoint operations can be show and save.
Let's take a look at Spark worker UI in foreachPartition job one more time:
Spark worker foreach Partition job stages
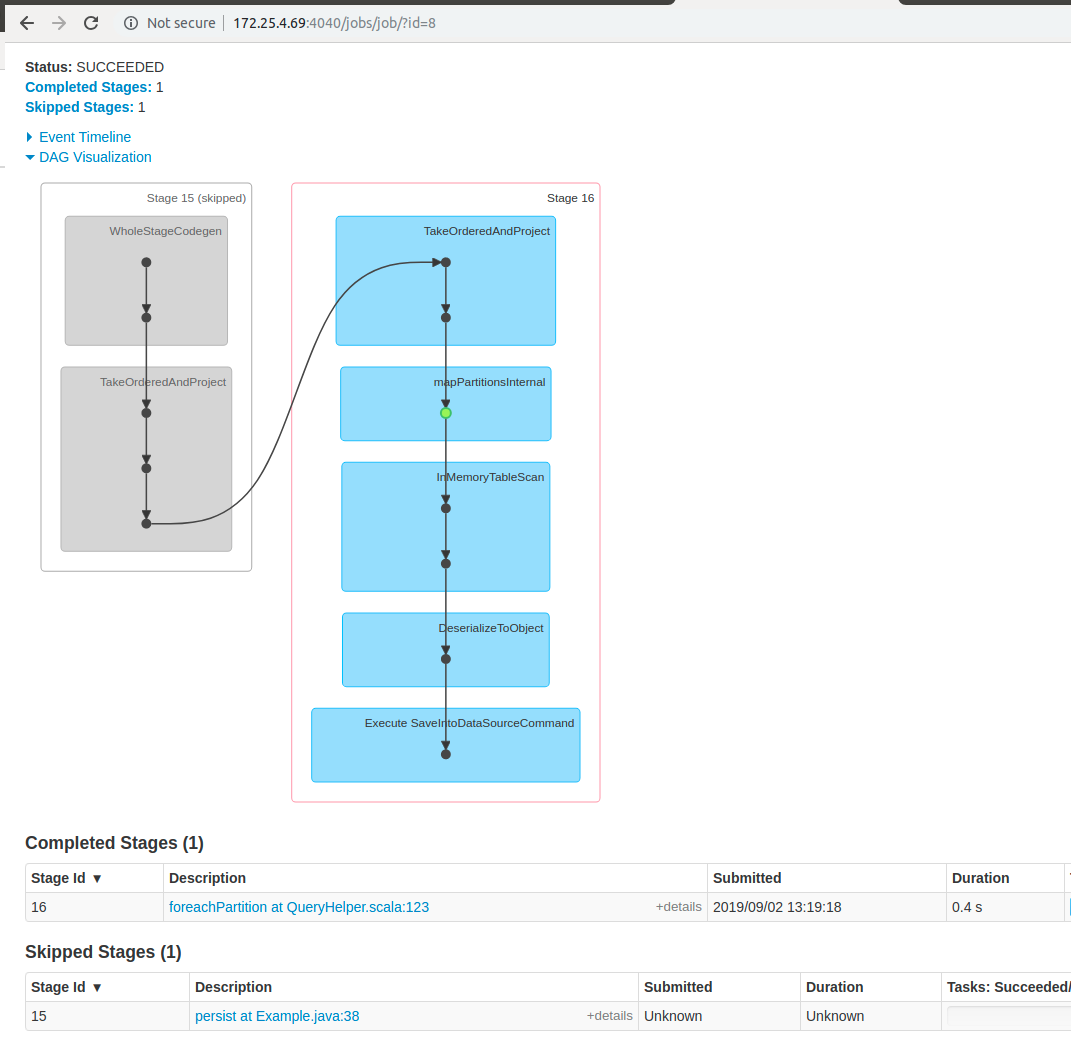
Here we can see that foreachPartition has two stages as before, but one of these stages was skipped because we now use the cached data from the persist stage (which was done during the count operation) and don’t try to read from the disk each time.
Let’s look at “Stages” tab one more time after new execution:
Spark worker stages tab
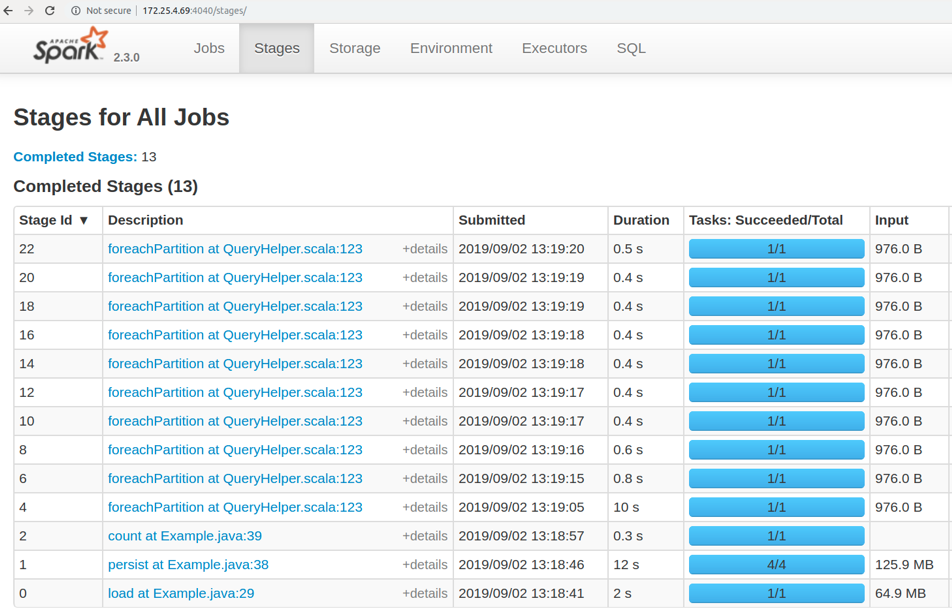
So you can see that now we have additional persist and count that cached the data into memory one time. After that, the foreachPartition stage will use cached data from memory. This can save significant execution time in cases where you are going to use the same data a lot of times for writing to Ignite.
Here are the new timings after applying the caching:
Item |
Before caching |
After caching |
Reading from the disk and data preparation |
97 sec |
load - 2 sec total - 14.3 sec |
Writing to Ignite |
13.6 sec |
foreachPartition - 10+0.8+0.6+0.4+0.4+0.4+0.4+0.4+0.4+0.5 = 14.3 sec |
You can see that the writing time didn’t change a lot, but the reading time was significantly improved.
Can we optimize the write job more?
Here the main list of optimizations that you can try:
- Common Spark optimizations from this list – https://spark.apache.org/docs/latest/sql-performance-tuning.html. You can try to add more executors, memory and cores. It depends on your resources.
- You can do optimizations of the Ignite data streamer used during the writing process using this: https://apacheignite-fs.readme.io/docs/ignite-data-frame#section-ignite-dataframe-options. You can increase the defaults for greater throughput.
- Finally, you can increase the number of threads for data streamer processing: https://apacheignite.readme.io/docs/thread-pools#section-data-streamer-pool.
Short tips for debug
Here is a short list of tips that can help you do debugging more easily:
- Set memory-only cache mode to avoid swapping to disk.
- Add the repartition operation for the final DF. It will separate the time of saving to the GG process from other operations. This step is required only for debugging purposes, so don't use it in production.
- Go to "Stages" tab on the UI and try to find:
- foreachPartition at QueryHelper.scala:123 – The time of this stage will contain only time of saving to GG.
- rdd at QueryHelper.scala:123 – The time of the current operation will contain the time of other operations (from a pipeline) that were done before storing to GG.
- In the case of caching, check that stages from Step 3 skipped the stages for caching of the data (it can skip "persist at" or "cache at" stages).