
Imagine that we need to build a monitoring infrastructure for a distributed database, such as Apache Ignite. Let’s put metrics into Prometheus. And, let’s draw charts in Grafana. Let’s not forget about the notification system—we’ll set up Zabbix for that. Let’s use Jaeger for traces analysis. For state management, the CLI will do. As for SQL queries, let’s use a free JDBC client, such as DBeaver.
Now, let’s configure an authentication system for each of the tools, so that no information can leak. We are there. We have a bunch of tools that, together, are more complicated than the distributed system itself.
And, now, let’s hire a team of specialists to set up and run this orchestra and live happily ever after. Or not, because we simply won't get the resources that the task requires. We’ll have to search for ways to reduce the cost of provisioning and maintenance. In GridGain, my team developed our own tool. The tool addresses all the needs of the distributed in-memory computing platform Apache Ignite and GridGain’s commercial versions of Apache Ignite.
What Our Wheel Can Do and Why We Had to Reinvent It
Control Center provides an interface that is integrated with and designed for Apache Ignite and GridGain clusters. It takes advantage of the features that are specific to those platforms. The visualization methods are selected to match the data coming from the cluster. You can manage the state of the nodes, take data snapshots, and run SQL queries from the user interface. If something is configured incorrectly, error messages suggest the steps that are needed to fix the problem.
General purpose tools (such as Grafana, Prometheus, Zabbix and others) require many hours and days of reading documentation and testing integration methods. They present a much harder path, a path that requires patience.
However, it is not enough to understand just one product. You need to use a collection of tools. Even with perfect configuration, the tools won’t be coordinated with each other. And, you’ll still have to use a terminal to run management commands.
Let’s take a closer look at what the Control Center does well.
Control Center Setup
The Control Center development team made the process of setting up a cluster for monitoring as simple as possible. The configuration steps are described in detail in the Control Center documentation.
In the case of Apache Ignite cluster, you download a Control Center agent, configure it and register the cluster with Control Center. For GridGain clusters, you can skip the agent download step. Simply configure the cluster monitoring settings and register the cluster with Control Center.
Metrics Dashboard
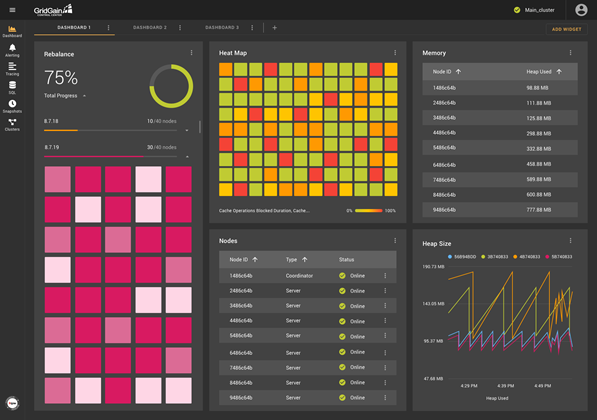
The basis of a monitoring system is the ability to work with metrics. Control Center gives special attention to this functionality. The dashboard screen enables you to configure widgets that are based on the metrics that come from the cluster. Among the available methods of visualization are charts, histograms, tables, and heat maps. There are also widgets that are specific to GridGain clusters, such as node list or rebalance visualization.
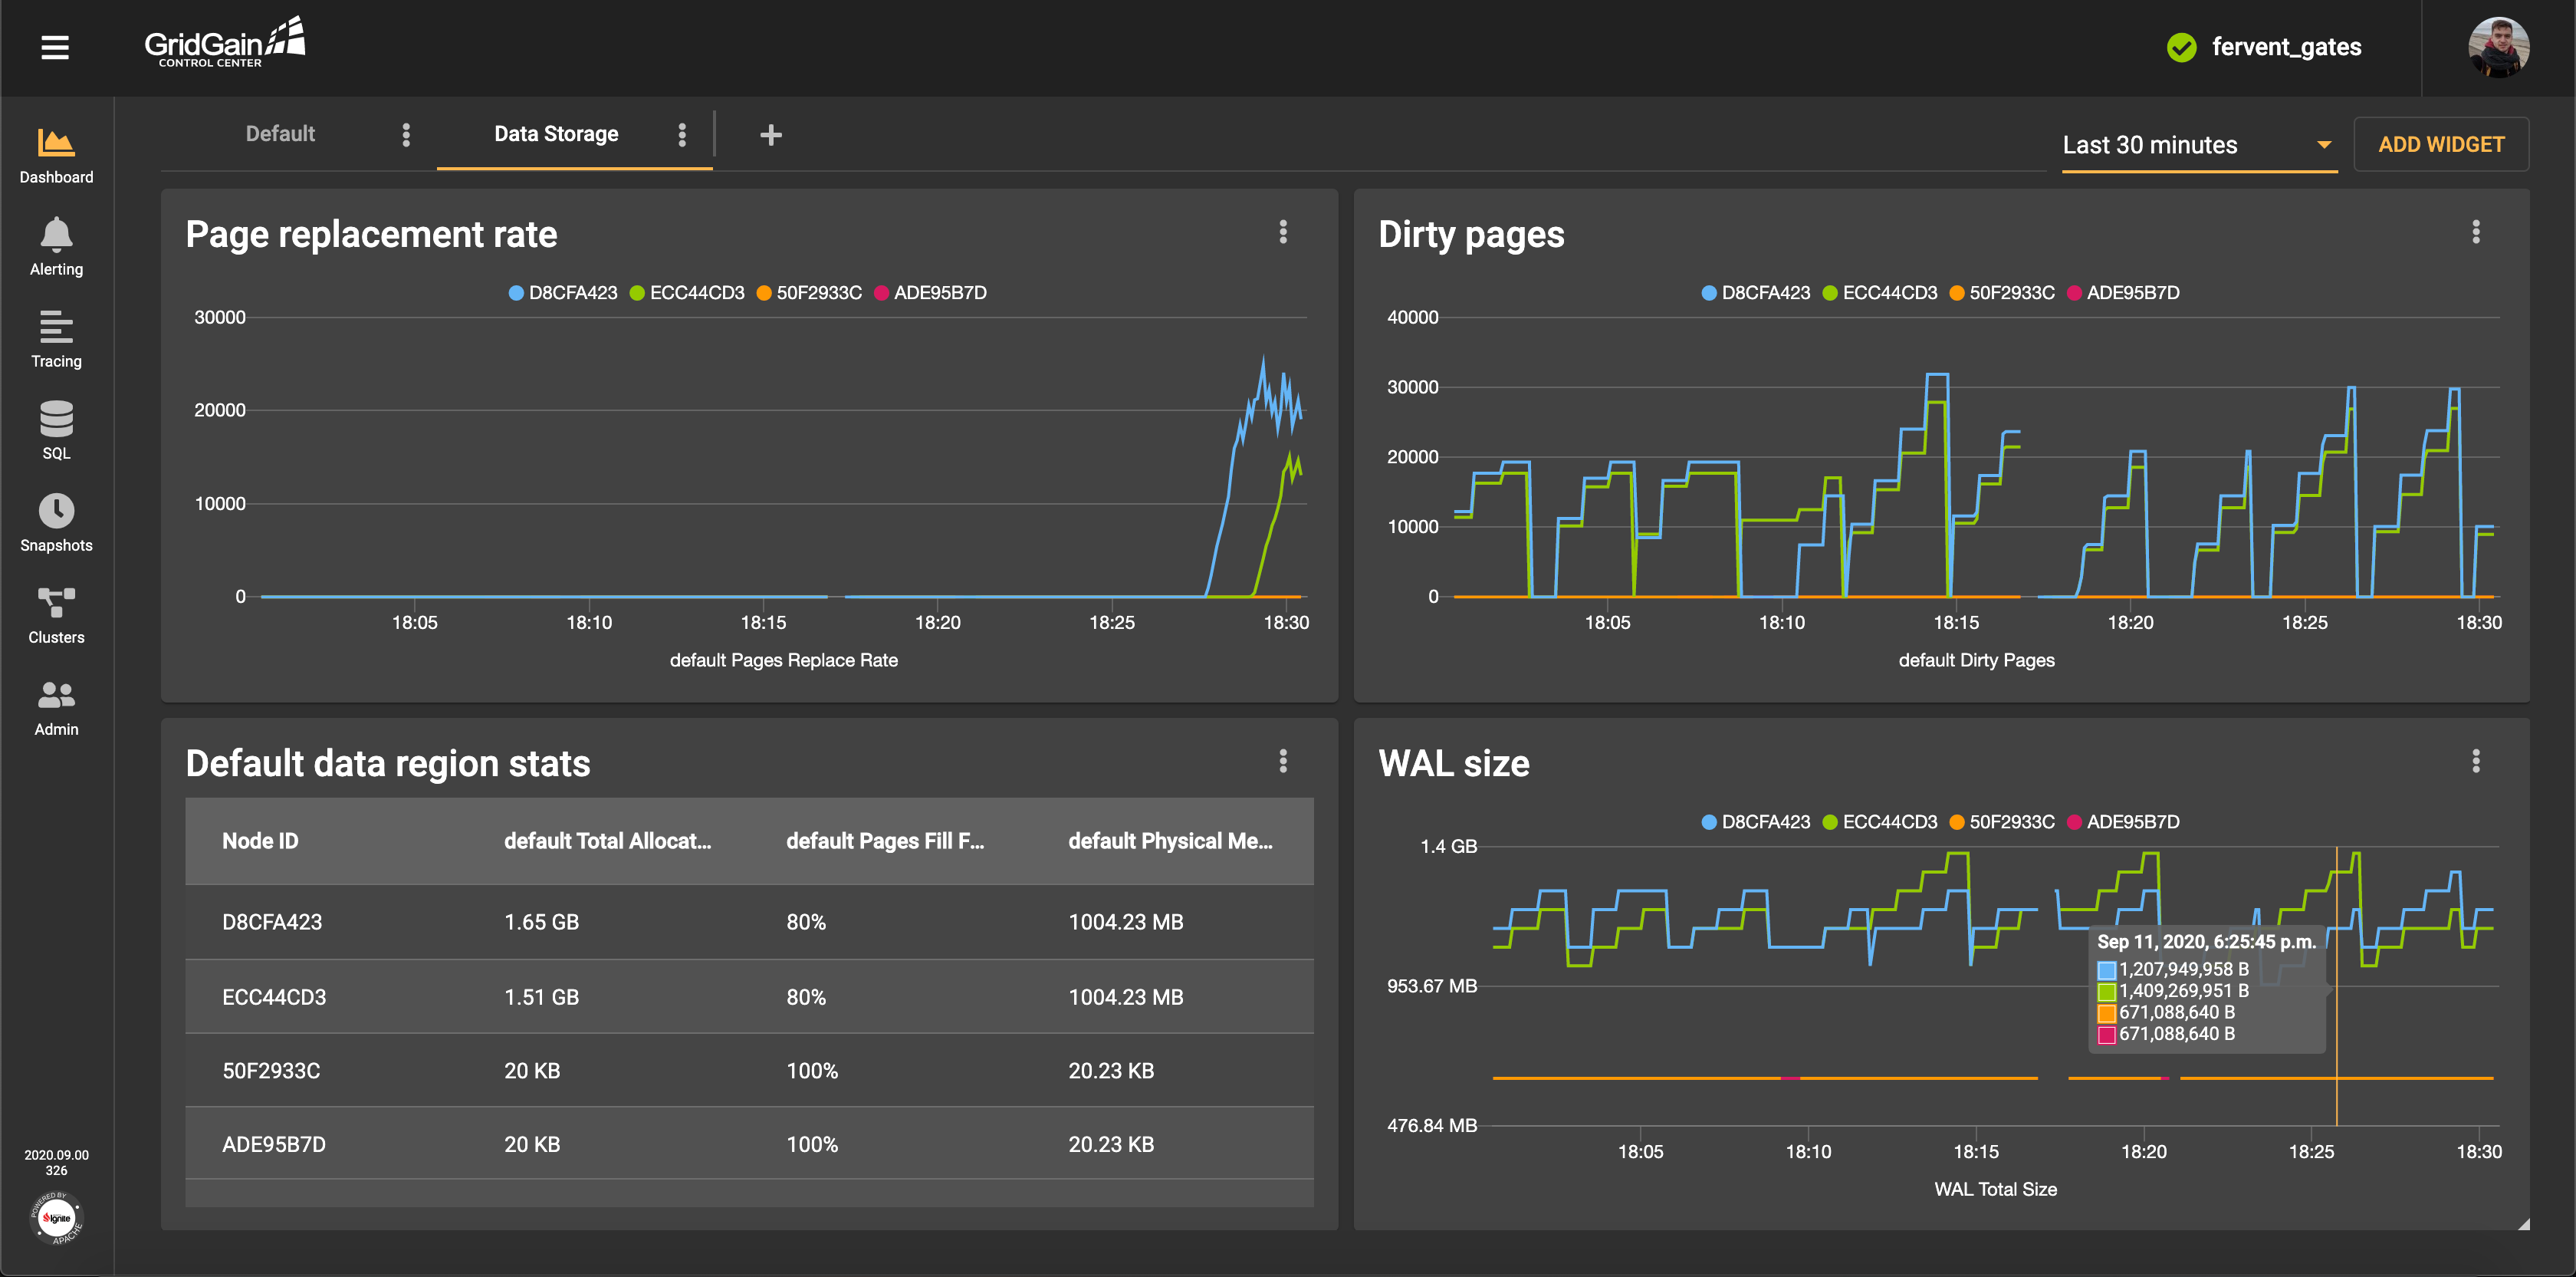
A dashboard contains a set of widgets. Each widget is placed in a convenient location, relative to the location of the other widgets. Multiple dashboards can enable you to create specialized monitoring screens for Ignite subsystems. For example, the monitoring screen for data region state might look like the following:
Alert Setup
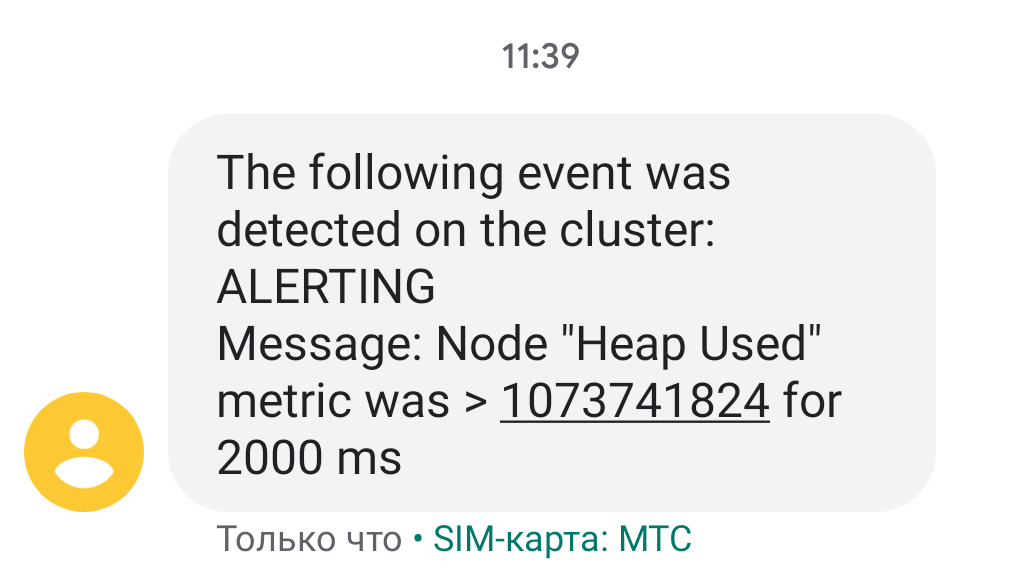
You can use metrics not only to display information visually but also also to generate alerts. The alerts are triggered if the specified conditions are met.
If you are worried that a server will run out of memory, you can relieve your anxiety by setting up SMS or email notifications. If a metric crosses and holds a specified threshold for a specified period of time, you receive a message like the following:
Tracing
Many cluster operations require communication between nodes. If a problem or delay occurs, it can be difficult to determine which node is the culprit and at what stage the problem occurred.
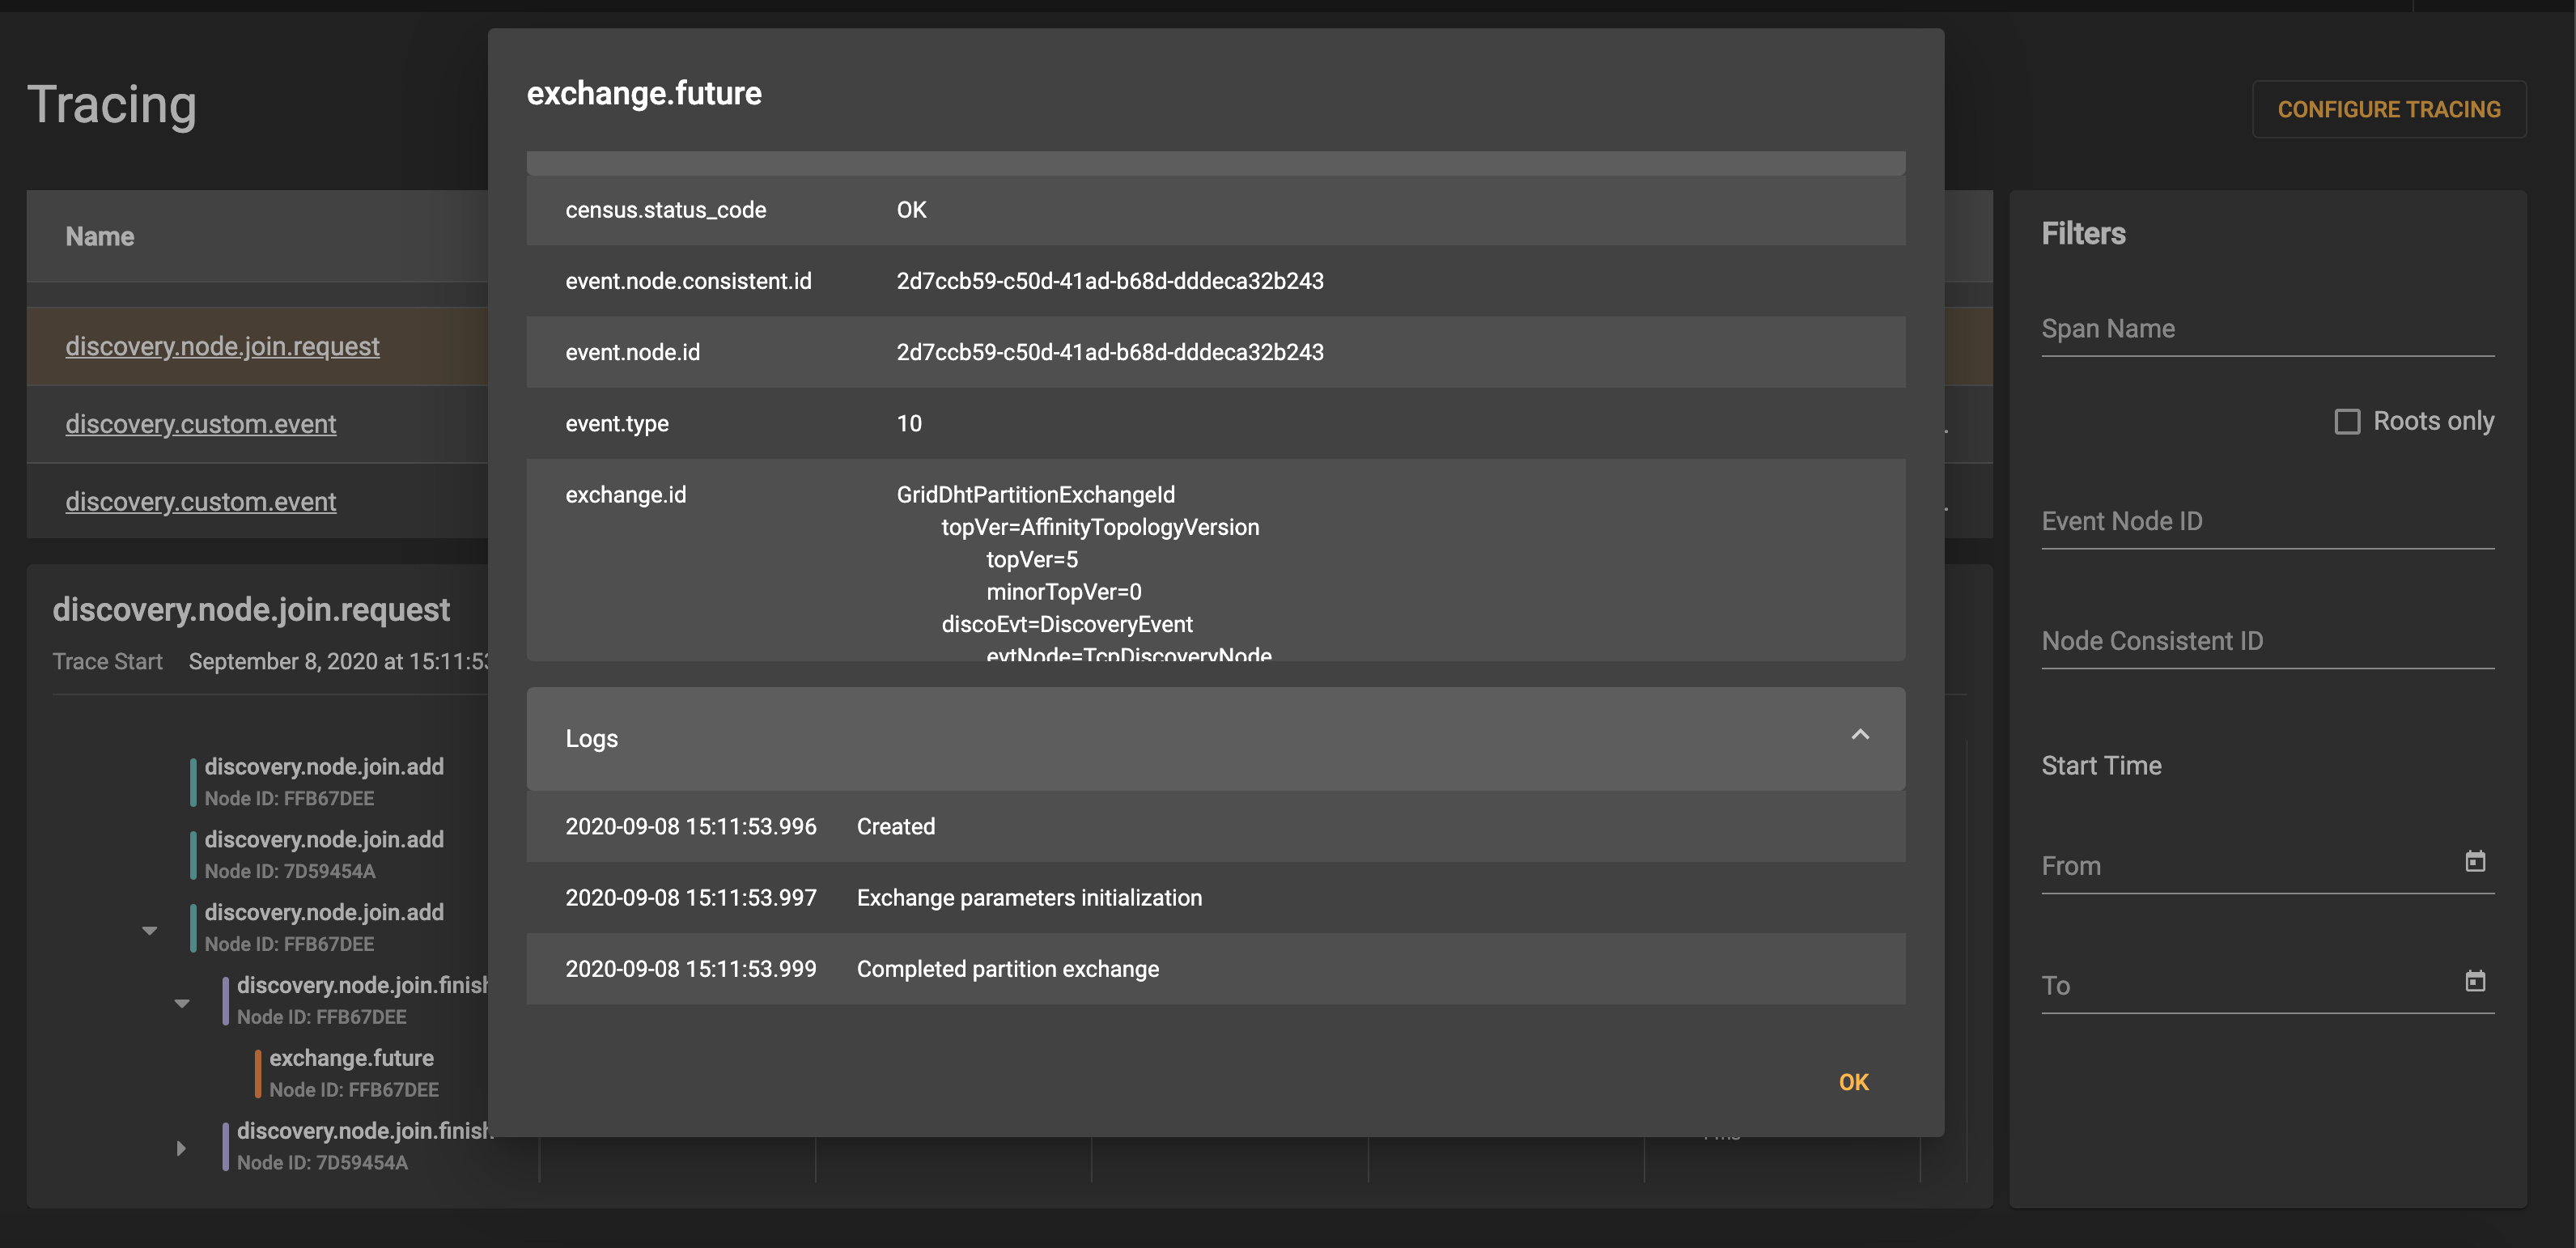
Tracing is a new feature in Ignite and GridGain clusters that makes it easier to analyze such situations. The framework enables you to track the execution of operations, even if the operations are distributed. Each execution stage (span) is logged and tied to the operation for which the trace was started. All transactions in the cluster can be tracked, and it is possible to identify the stage that required the most time. Although tracing appeared quite recently in Ignite and GridGain, its support has already been implemented in Control Center.
The most important information about traces is displayed in a prominent place, so you can find it relatively quickly:
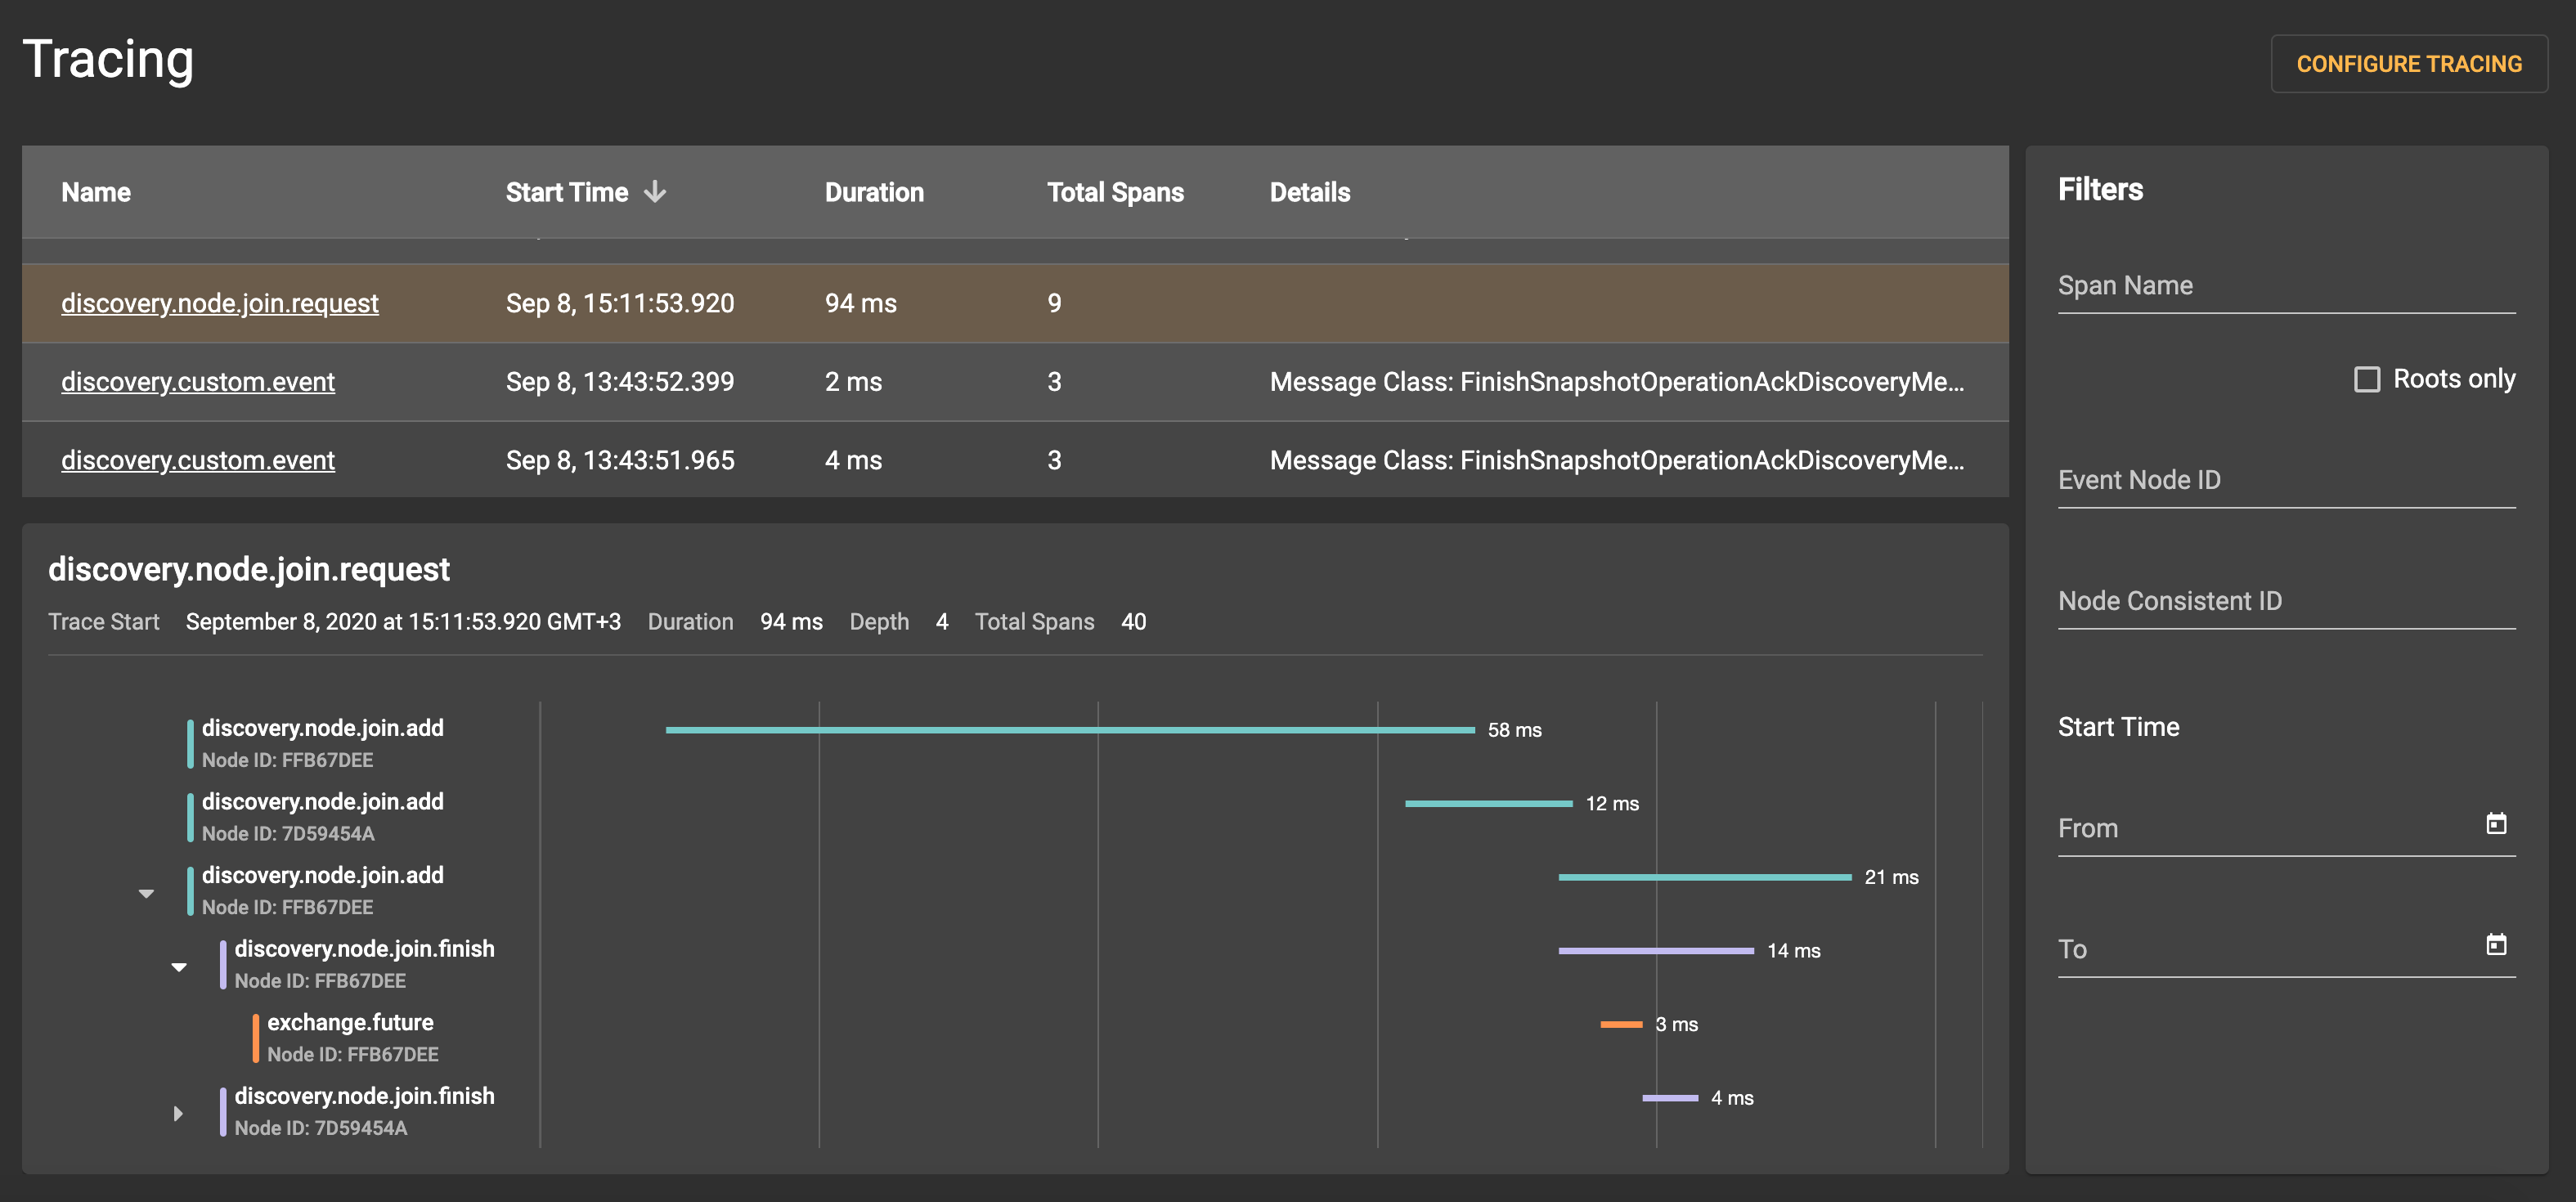
Detailed information for each span is available:
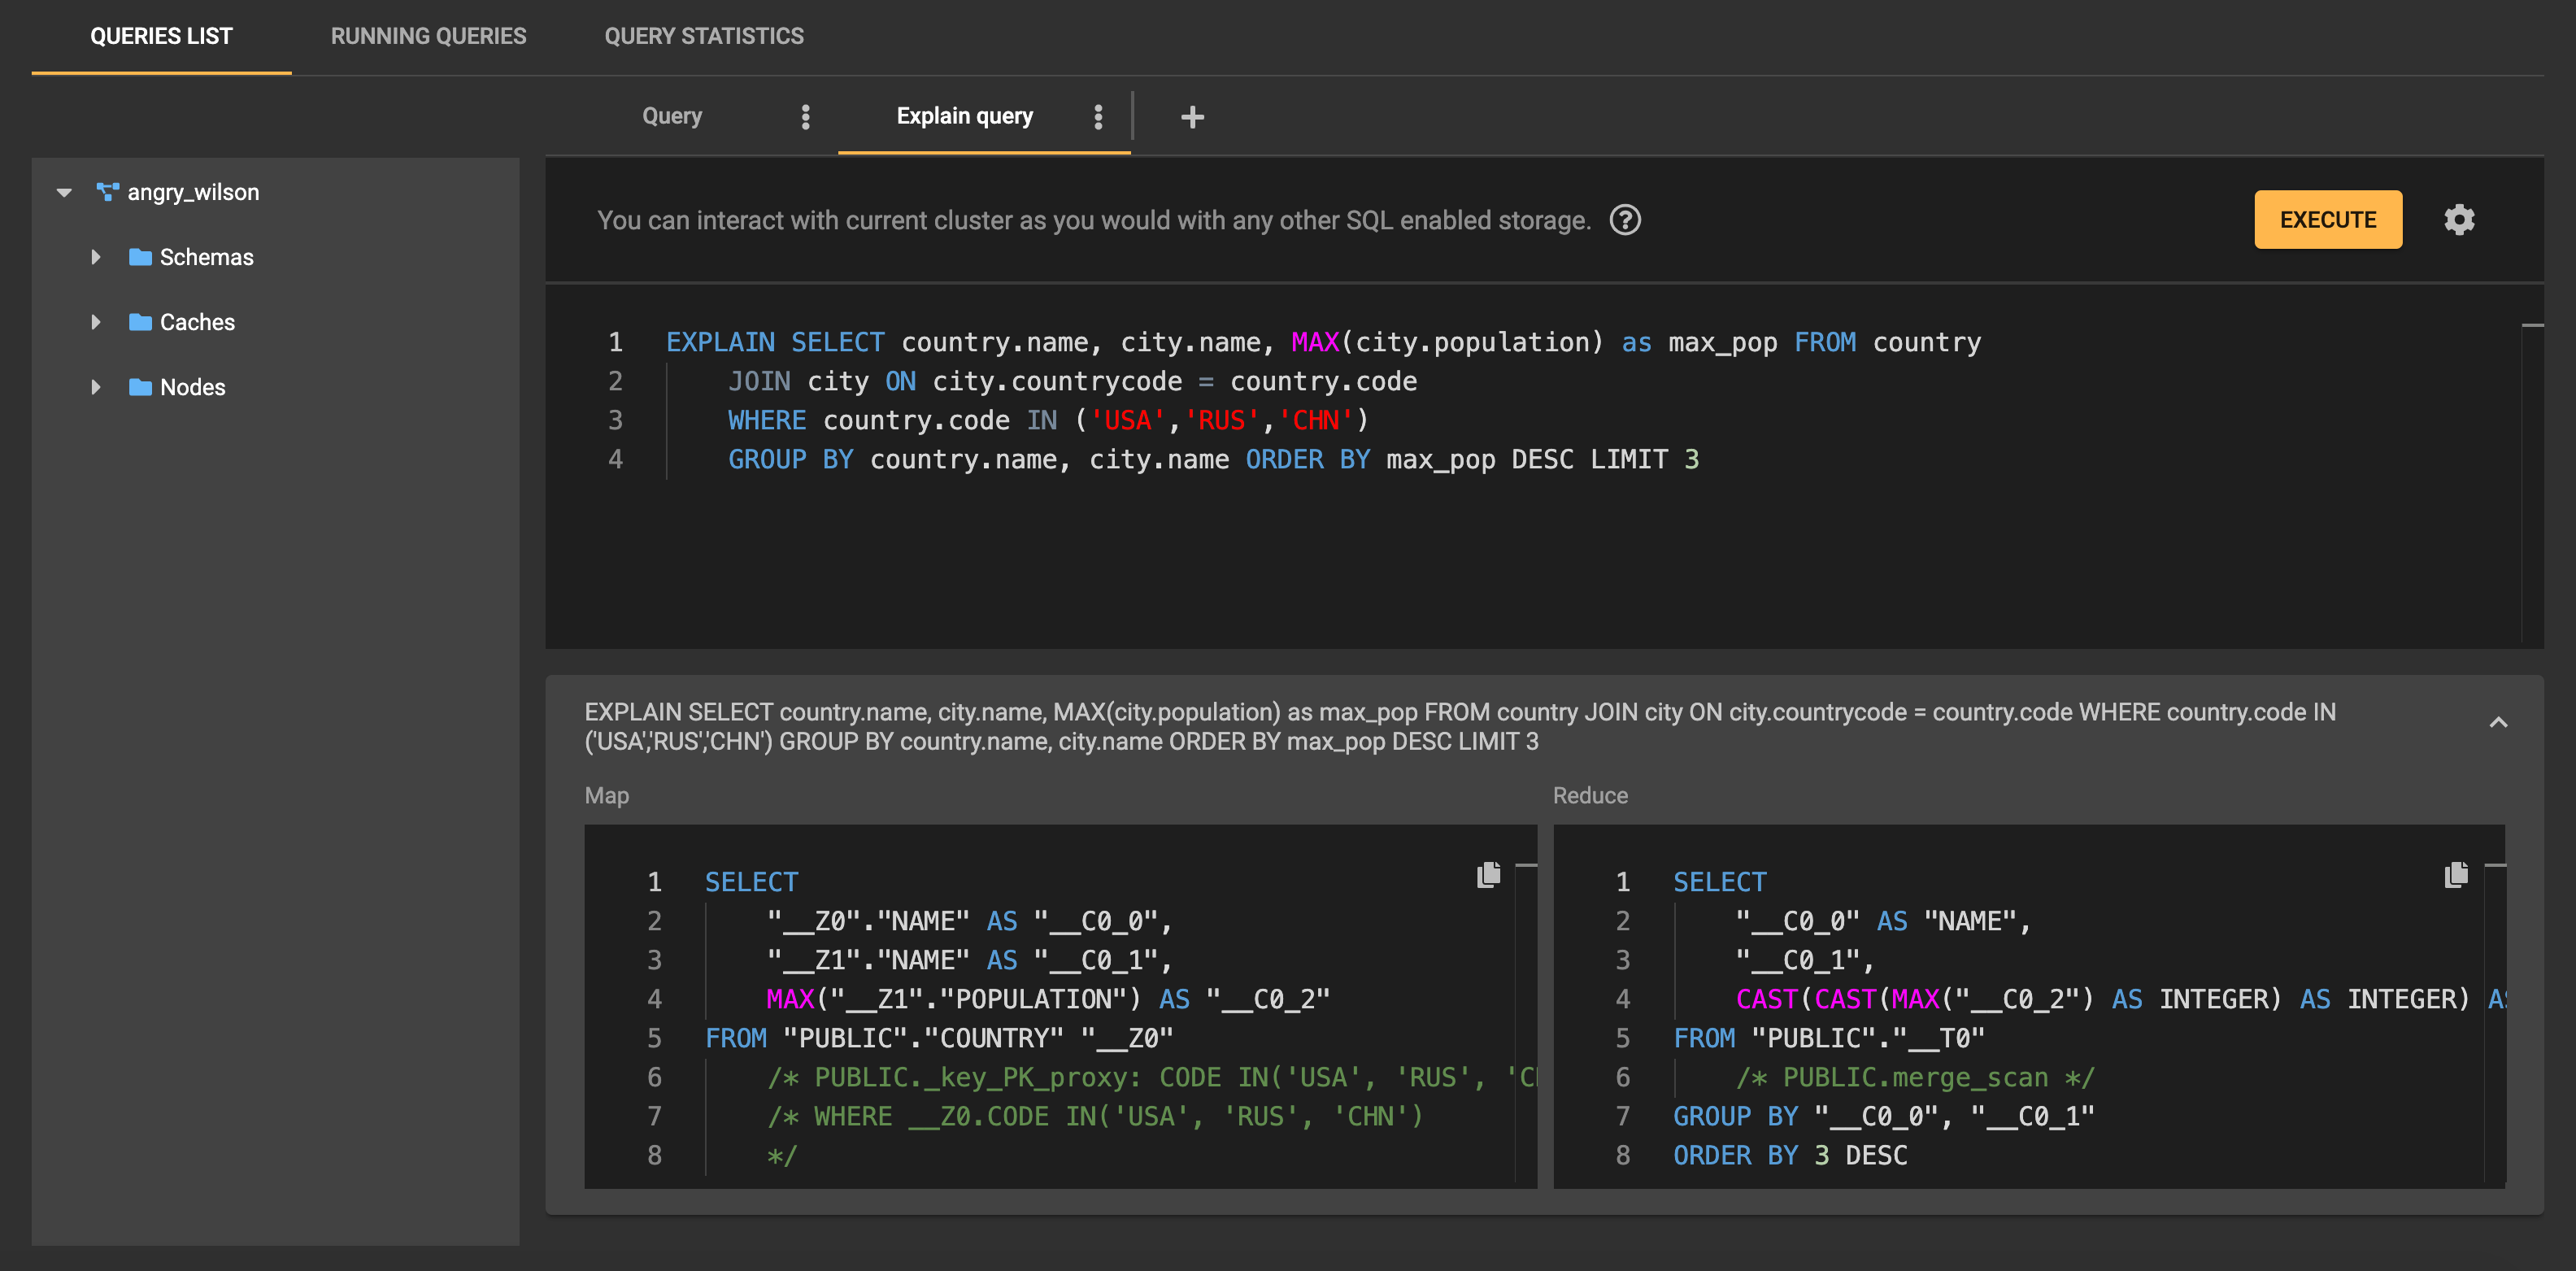
SQL Queries
Ignite can use SQL to work with data. There is a section in Control Center that focuses on actions that are related to SQL queries. There, you find the code editor with basic editing features such as syntax highlighting and code completion. You can create multiple query tabs. The tabs persist between launches:
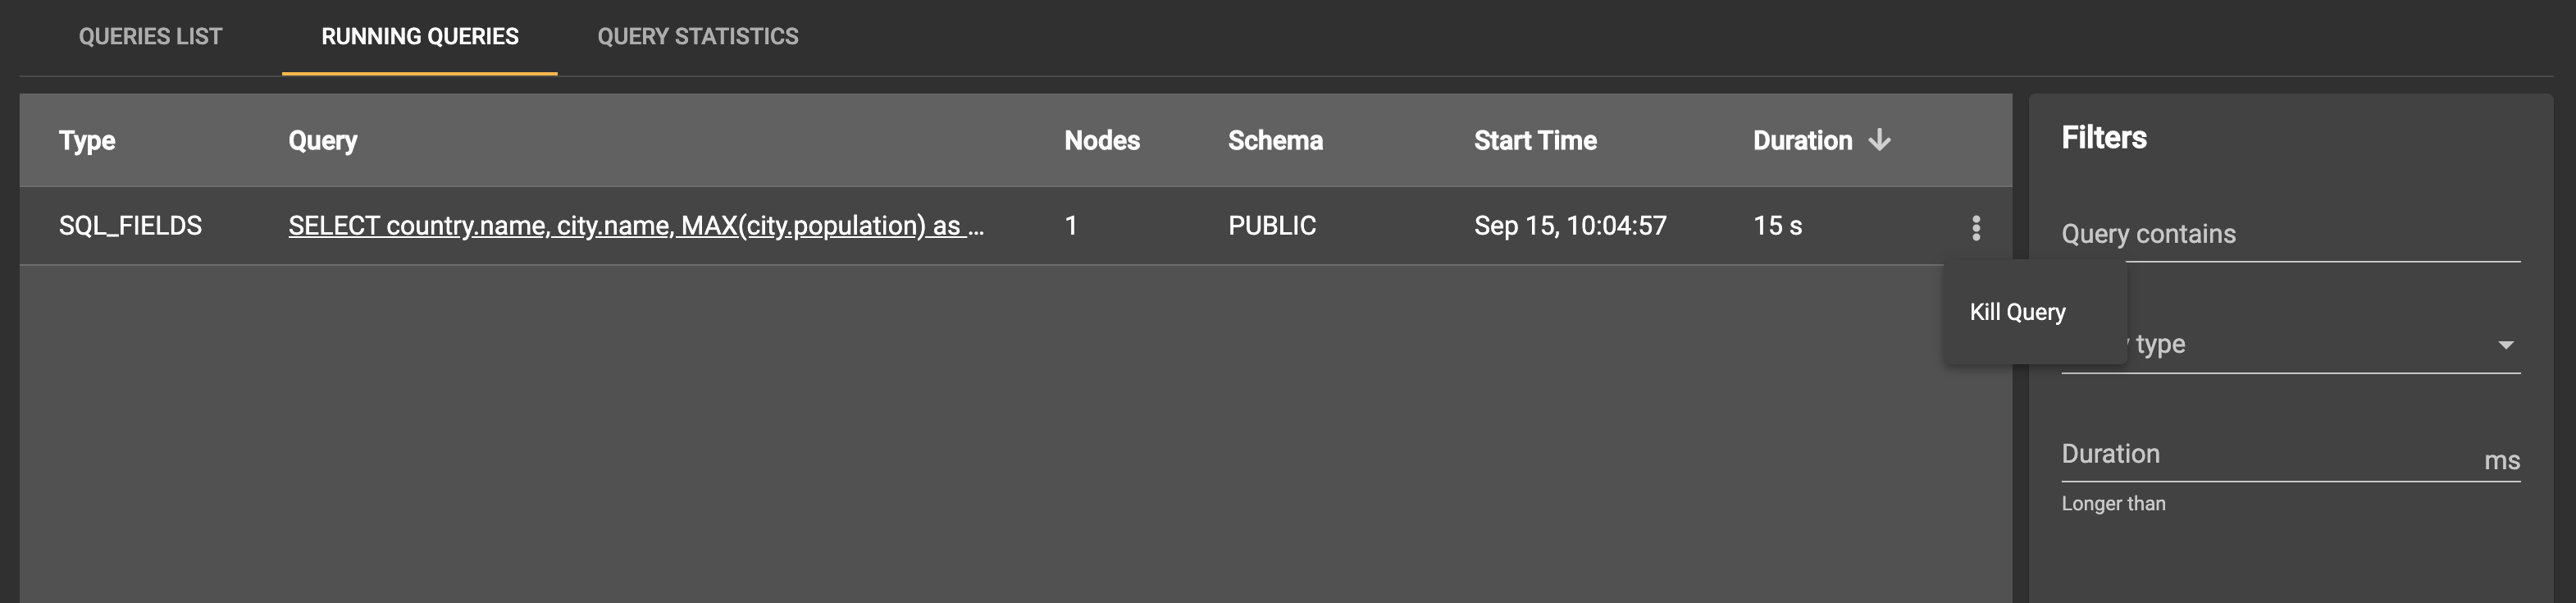
The Running Queries section shows the queries that are currently being executed by the cluster:
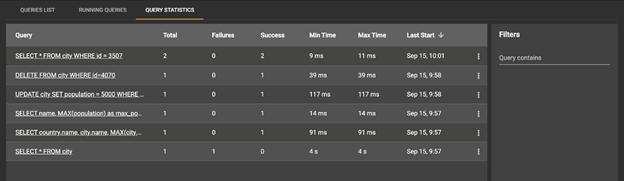
Also, the Query Statistics section contains information about the number of executions, successes, and failures and about execution time:
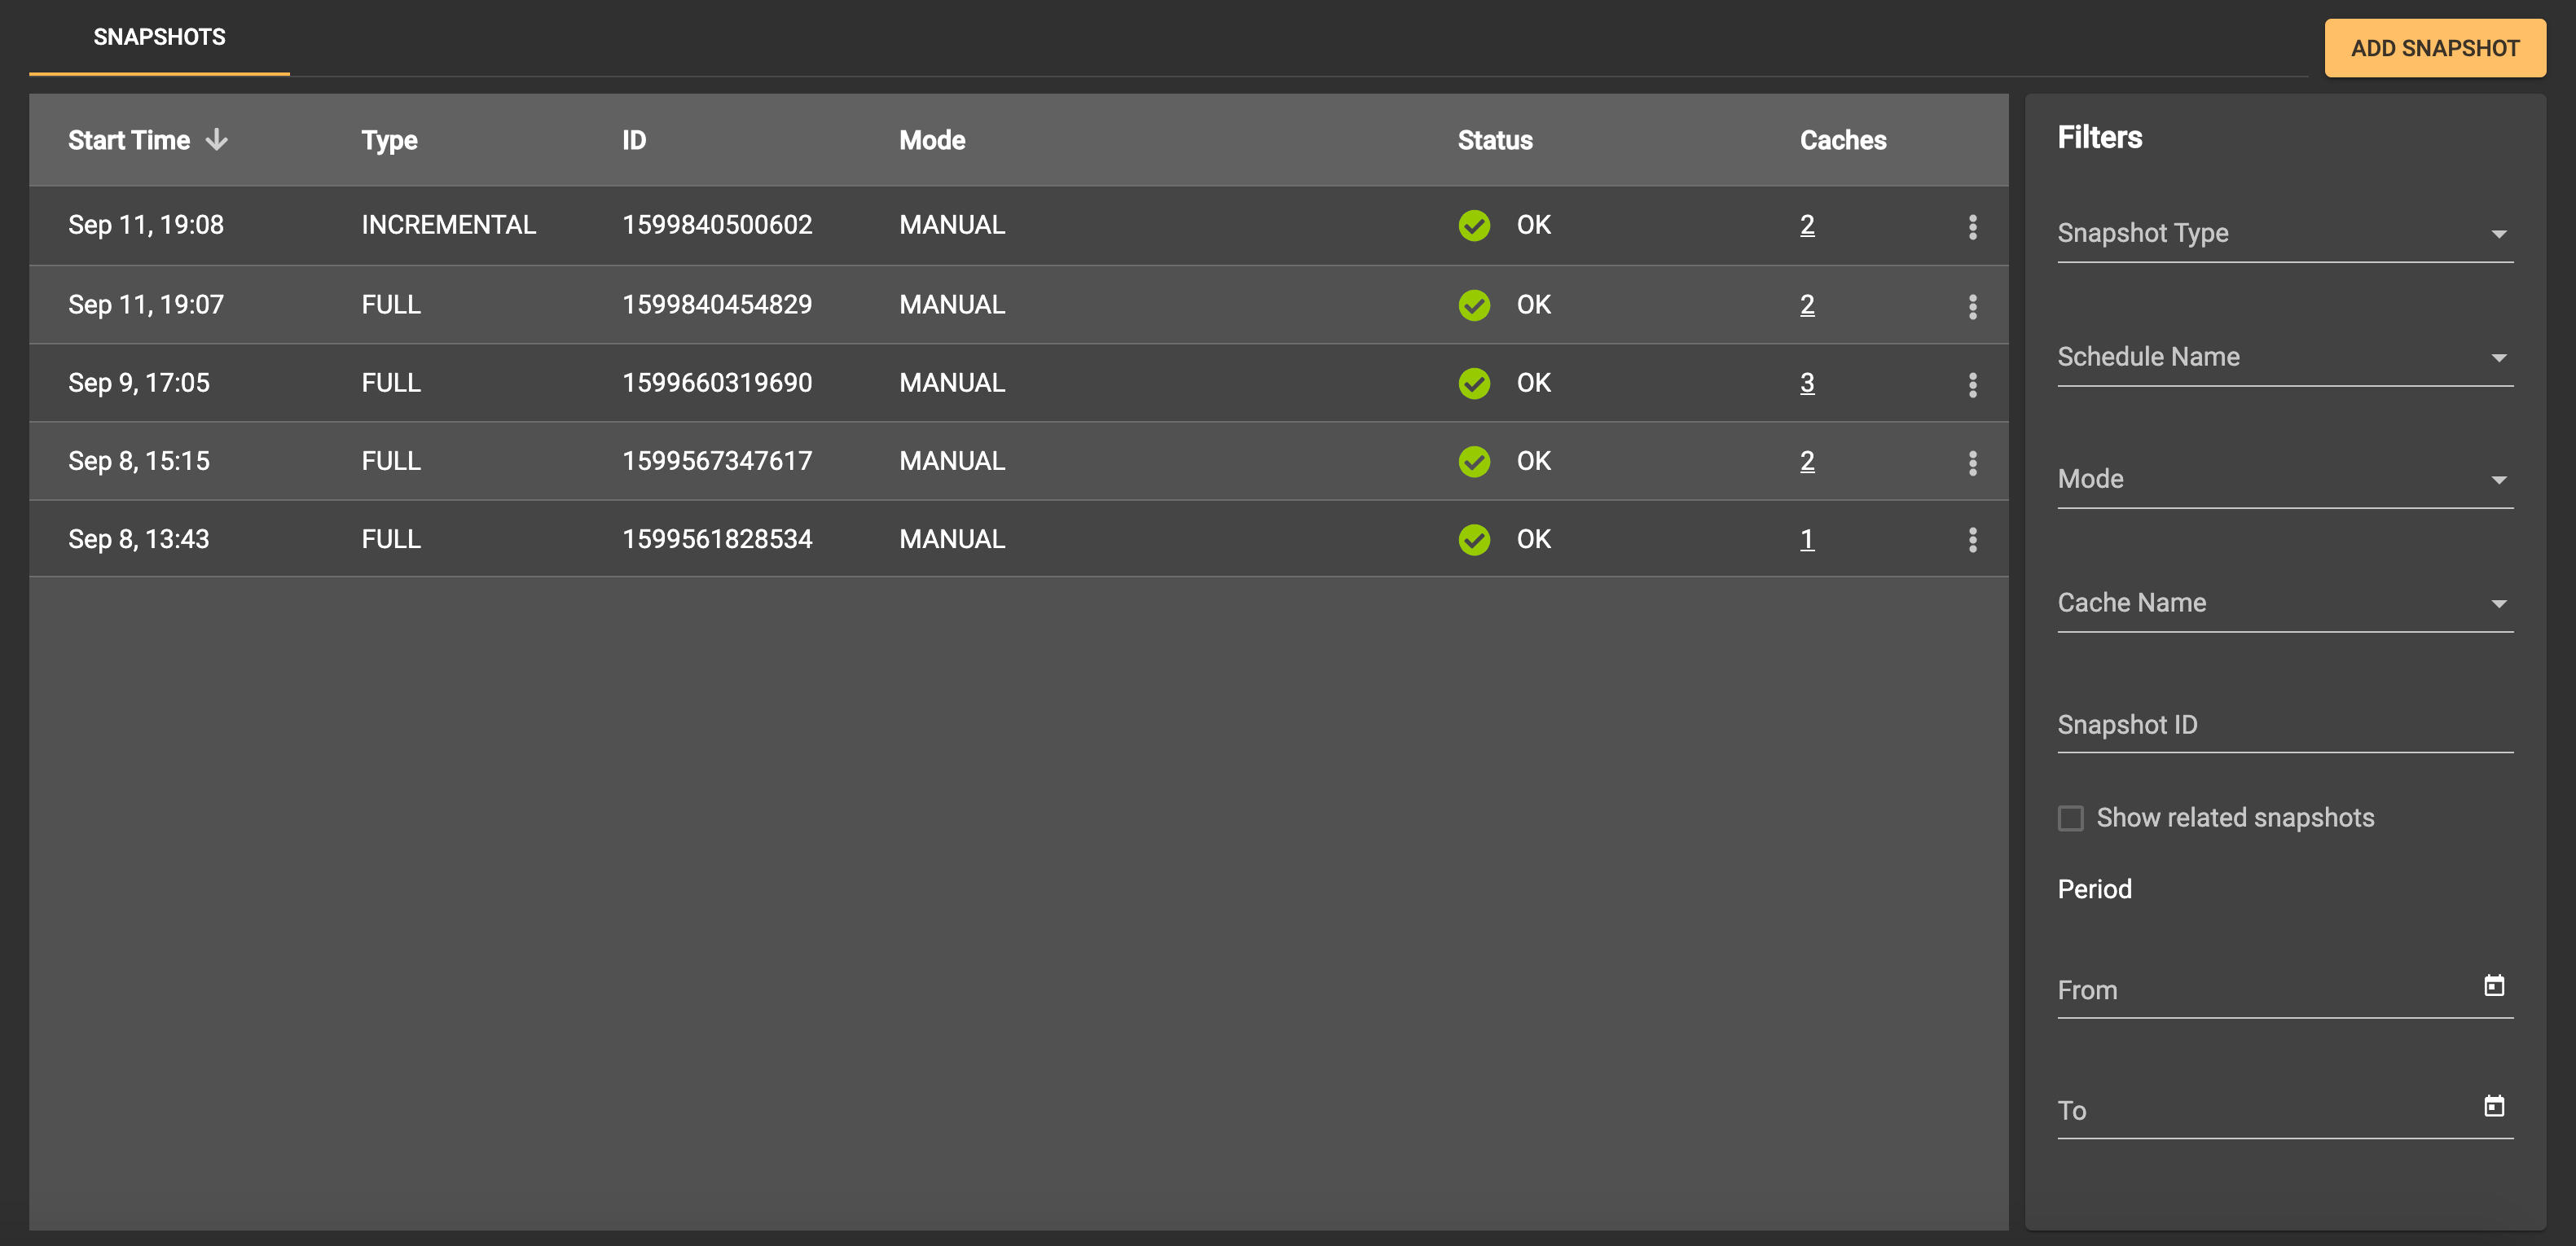
Data Snapshots
With GridGain Ultimate Edition, you can take data snapshots and, thus, create backup copies of the record set that exists in the cluster when the snapshot process begins. In this case, you do not need to stop the cluster. There is a section in Control Center for working with data snapshots. In this section, you can create a snapshot and apply, check, and move snapshots. Control Center supports work with full and incremental snapshots, with or without compression:
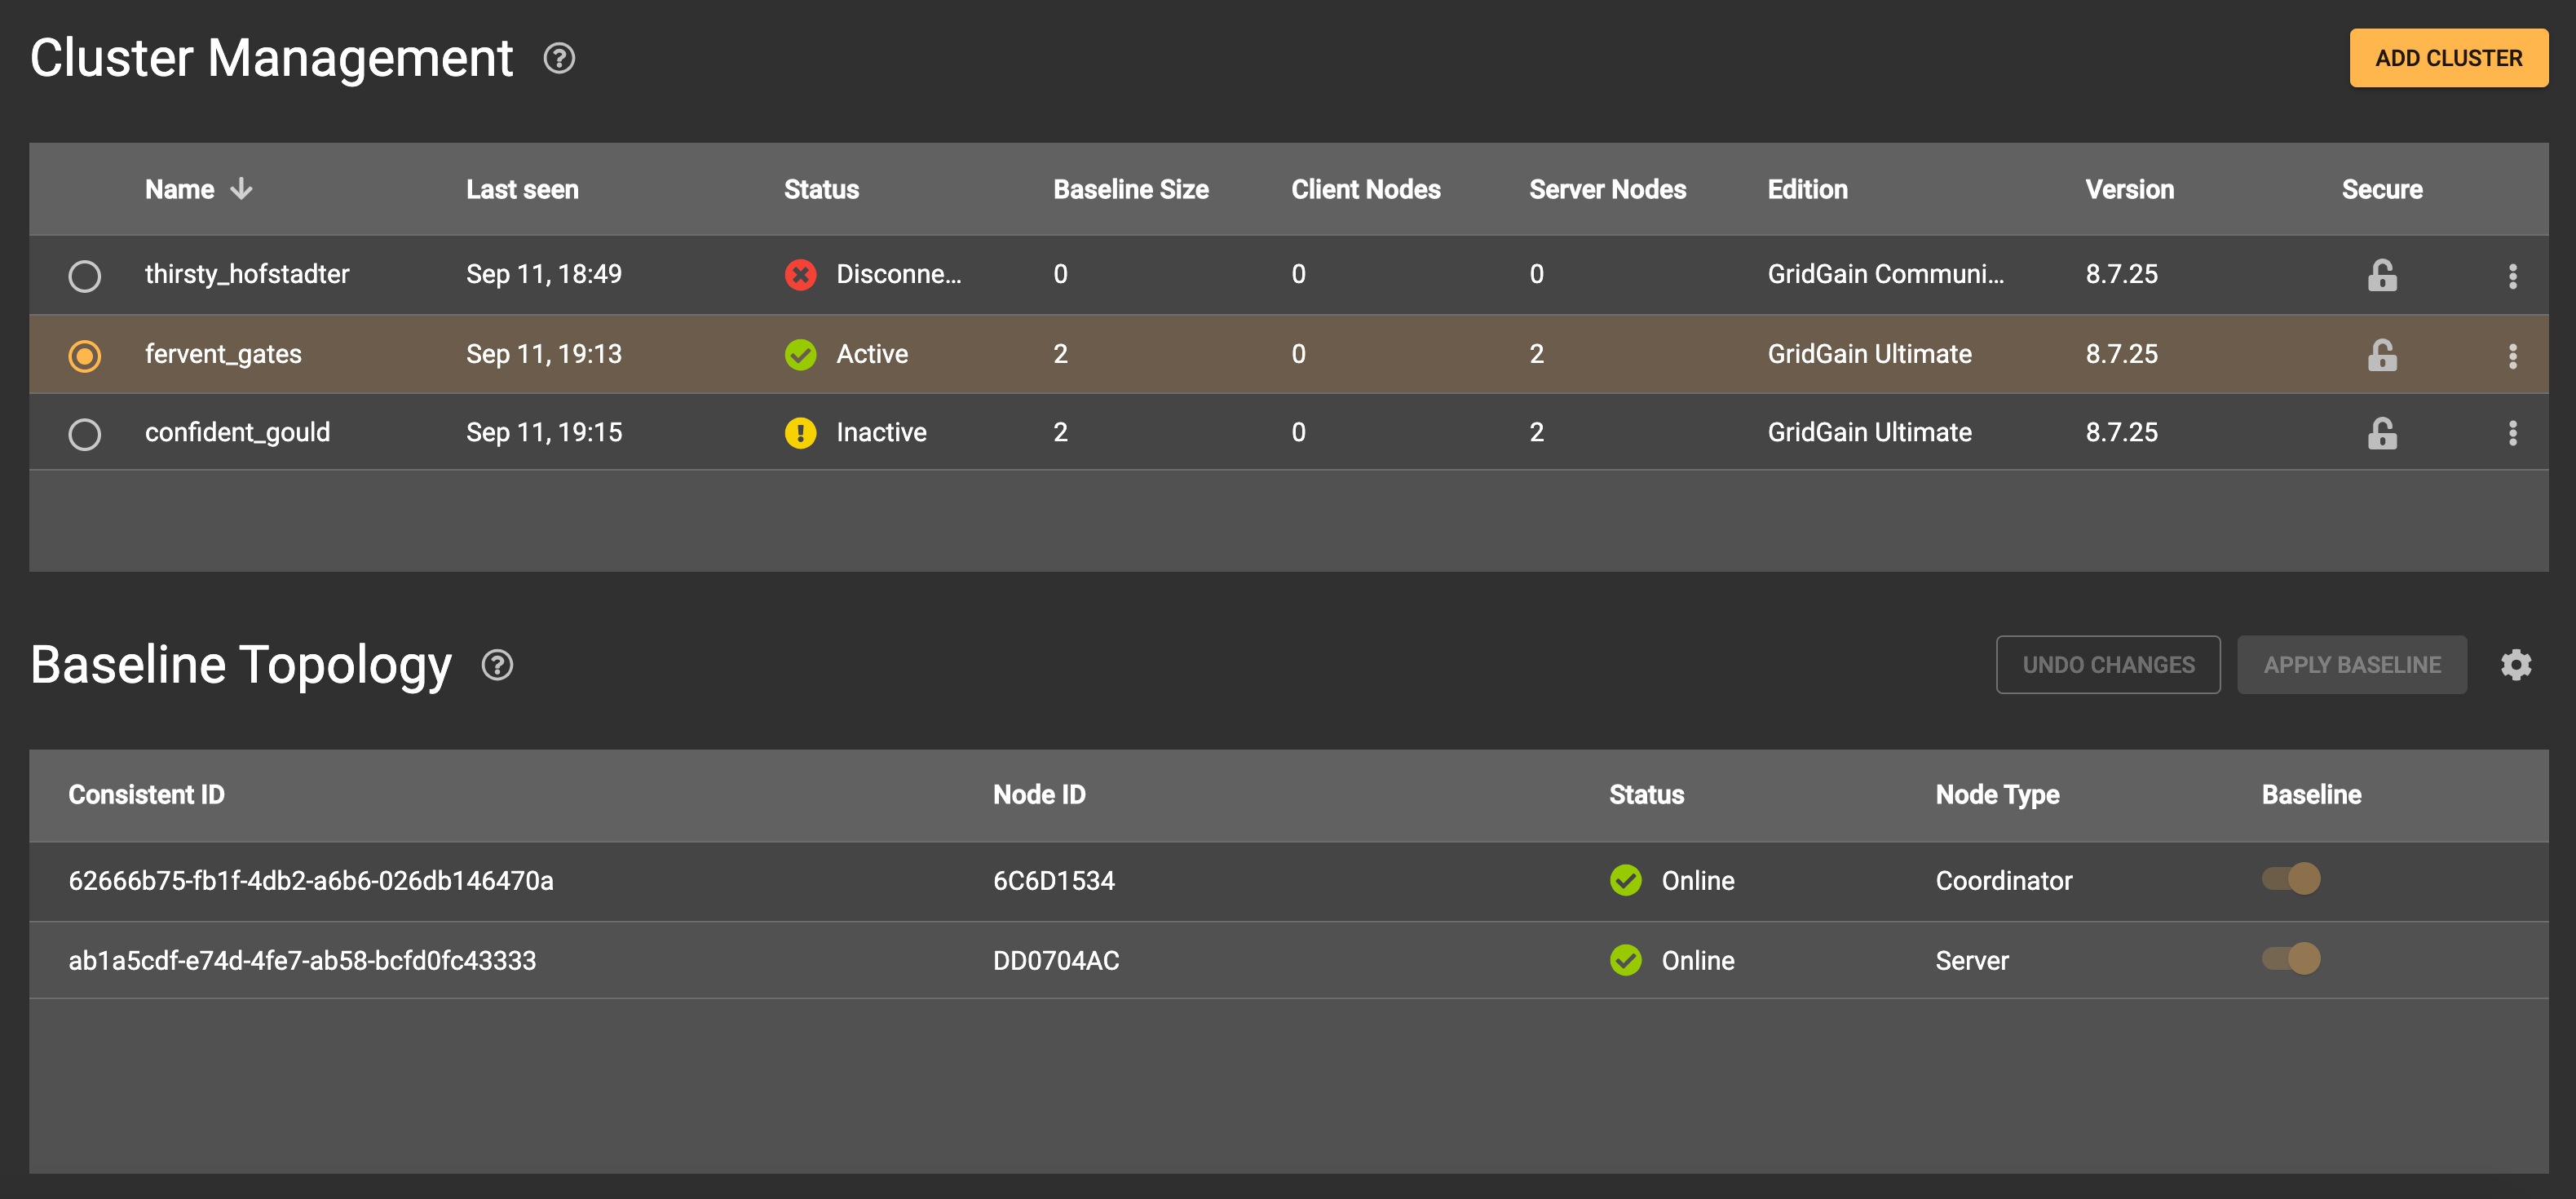
Cluster Management
Administrative operations (such as activating and deactivating, changing a set of nodes in the baseline topology, and configuring clusters for monitoring) are collected on the Cluster Management screen. On this screen, you can view a list of your clusters and perform configuration actions that typically require the CLI.
The Cluster Management screen is especially useful for administrators who perform actions that require the addition of nodes to the topology or the removal of nodes from the topology:
Architecture
Now, let’s take a look at how Control Center works. Let’s see how an interaction with the cluster goes, how the service information is stored, and what internal Ignite capabilities are used in the Control Center implementation.
Agent
Prior to the release of Control Center, Web Console provided monitoring using an alternative way to connect to the clusters. In Web Console, the agent works in an independent process and connects the cluster via the REST API. Such a scheme requires configuration and maintenance of an additional component and requires the user to think about failover and protection of the data that passes through the agent. We replaced the Web Console scheme with a simpler one in Control Center, in response to the feedback that we received from our users.
With Control Center, the link to the cluster is an agent that functions as a part of each node. The Control Center agent is integrated with Ignite via API for plugins. If there is a required module in the node classpath, the plugin is initialized and communicates with Control Center. The agent and Control Center communicate with each other by using STOMP over WebSocket.
At any given time, only one agent is working in active mode and is connected to Control Center. The other agents are in standby mode. If a node with an active agent leaves the topology, a new responsible node is selected. The fact that the agent and the node are started in the same process simplifies the deployment and support of the monitoring infrastructure. This scheme also allows the agent to use the node’s Java API directly instead of requiring the agent to use an external API to send requests to the cluster.
Connection between Clusters and User Accounts
As shown previously, you need a special, temporary token to start monitoring a cluster. In this scheme, there are three identifiers:
- Cluster ID is a value that is generated once during the entire work time of a cluster. Within the internal structures of Control Center, the value is a unique cluster identifier. Every request to the cluster and all information that comes in from the cluster is accompanied by the identifier. Cluster ID is an internal implementation detail, but the user can see it, for example, as part of a URL in the browser’s address bar.
- Cluster secret is a value that is paired to cluster ID. The value is used for confirmation of cluster authenticity. An attacker might gain access to someone else’s cluster ID, but in this scenario the attacker cannot connect a fake cluster with the same cluster ID. The stolen cluster ID won’t pair with the cluster secret that is stored at Control Center.
- Connection token is a temporary token that can be used once to attach the cluster to the user account.
As a connection is being established between a cluster and Control Center, a check for correspondence of the cluster ID to the cluster secret is performed. If the check is passed successfully, a connection token is generated. The mapping between cluster ID and cluster secret, as well as between cluster ID and connection token, is stored on the Control Center backend.
The link that is displayed in the logs of the cluster nodes contains the cluster ID and the connection token. The cluster is linked to the user account that was active at the time the link was opened. If a user is not authenticated in Control Center, a temporary account is created. You can make the account permanent by opening the settings and setting up a password and specifying the missing data. You can also use the token directly via the user interface, without using the link.
Metrics
For Apache Ignite and GridGain clusters, a framework for simplifying work with metrics is being developed. All metrics in the system are registered in a registry. You can export the metrics from the registry in a convenient format. You can see details in IEP-35.
Ignite provides a possibility to implement an exporter that can be used to transfer descriptions and values of node and cluster metrics to a third-party monitoring system. Control Center uses the metrics framework and has its own exporter implementation. Once within a specified period of time, the agent collects the needed metrics from a cluster and sends them to Control Center. The metrics are processed in Control Center, stored to a database, and sent to the users who are engaged in browser sessions that are relevant to the metrics.
Trace Collection
In Apache Ignite, we develop functionality for collecting traces — the structured history of the execution of operations, with the duration of each step. Presently, it is possible to collect information about the work of the following components: Discovery SPI, Partition Map Exchange, Transactions, and Communication. In the future, we plan to collect information about all components.
Tracing is compatible with OpenCensus API. All traces and spans are registered in the OpenCensus framework and then go to SpanExporter, a special component for exporting information about spans. As with metrics, Control Center has its own exporter implementation inside the agent.
Spans within a trace can be recorded on multiple cluster nodes. This capability enables you to inspect distributed operations. Each span has a link to its parent, the operation that spawned the current operation. By collecting all spans within one trace, you can present a step-by-step, tree-like history of execution. To accomplish this task, each node periodically sends information about the spans that are registered locally to the node that has an active connection to Control Center. When all the spans within a trace are collected at the Control Center backend, the resulting trace is ready to be displayed to the user.
Data Storage
Choosing an appropriate database for storing system information was a simple task for us. Ignite does an excellent job of storing information about users and settings and of processing a large flow of incoming metrics and traces. For fault tolerance, data about users, data about traces, and data about metrics are stored independently. Thus, failure of the traces storage does not affect the ability to display charts that are based on metrics. Each cluster can be configured and optimized independently, after the specifics of the load are studied and considered.
Under the hood, Control Center uses the integration of Ignite with Spring Data and uses the Cache API directly. Database-state initialization and generation of queries and migrations are implemented via the Spring Data mechanisms. Because the functionality of Spring Data was not sufficient, the integration was extended. For example, the Querydsl support was added. The Queryds enhancement in Apache Ignite is currently in the code-review stage.
The history of metrics and traces is stored in Ignite for a limited amount of time, one day for metrics and one week for traces. After the prescribed time period, the information is deleted in accordance with the expiry policy that is configured in Ignite.
What’s Next?
Despite the current vast capabilities of Control Center, active development continues. There are still functionalities to be developed and improved.
Here is a list of the most significant improvements that are planned:
- Redesign of the mechanism for interacting with the metrics framework. The ability to create dashboard templates will appear in the near future. Currently, only a predefined set of templates is available for selection.
- Integration between metric-based widgets and error notifications. If an alert is configured for a metric, the alert should be reflected on the corresponding chart.
- Extension of the list of components that are available for tracing. This work is being done for Apache Ignite and GridGain In-Memory Computing Platform.
- Support for GridGain Data Center Replication. Management and monitoring capabilities for the replication process between GridGain clusters will be added.
Was It Worth It?
Development of a monitoring tool is a challenging task. For us, the task required a year of intense work from a whole team. What did we achieve? We improved the usability of Apache Ignite and GridGain clusters. By developing Control Center we solved the problem of having to configure the monitoring infrastructure for each of our users. Should you develop such a monitoring system by yourself? You must have really good reasons for doing so. For us, our work was an investment that made our product more convenient.