One of the most heavily used features in GridGain Nebula is the flexible dashboarding capabilities for monitoring cluster and node status. The drag-and-drop interface enables access to more than 200 metrics that are available in Apache Ignite or on the GridGain In-memory Computing Platform software running in data centers, private clouds, or the Nebula cloud.
Until now, there was no guidebook for defining dashboards. You had to figure out what metrics were needed in your dashboard to monitor Apache Ignite. Now GridGain has made dashboards a lot easier.
Customers have shown us some spectacular dashboards that they’ve built to monitor their unique applications. Those same customers asked us for suggestions about how to monitor Ignite clusters and asked what our Ignite experts use to monitor their applications. This interest in dashboards by our customers to our September 2022 announcement of predefined dashboards for SQL and native persistence.
Dashboard Templates
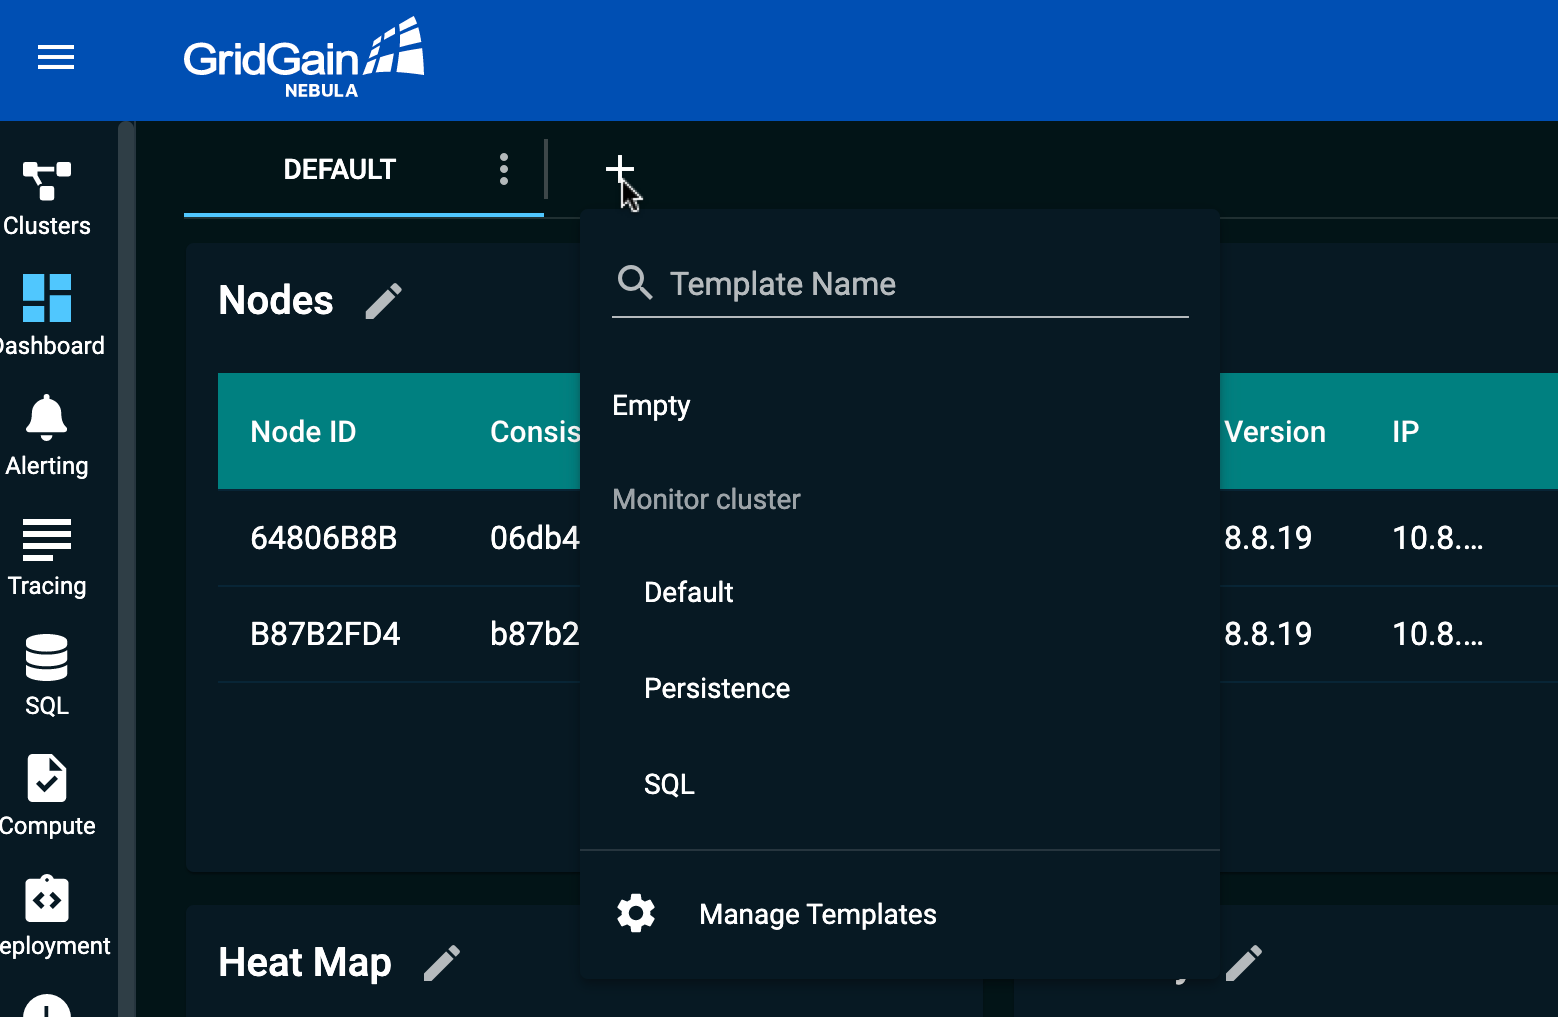
Predefined dashboards are delivered as Dashboard Templates – a new Nebula feature. Now, when creating a new dashboard, you can start from a set of pre-configured widgets that focus on one of the system components (Figure 1).

Figure 1. Dashboard Templates
You can also save the dashboards you create as your own custom templates and easily reuse them later. The new feature introduces templates for SQL and Persistence.
SQL Monitoring
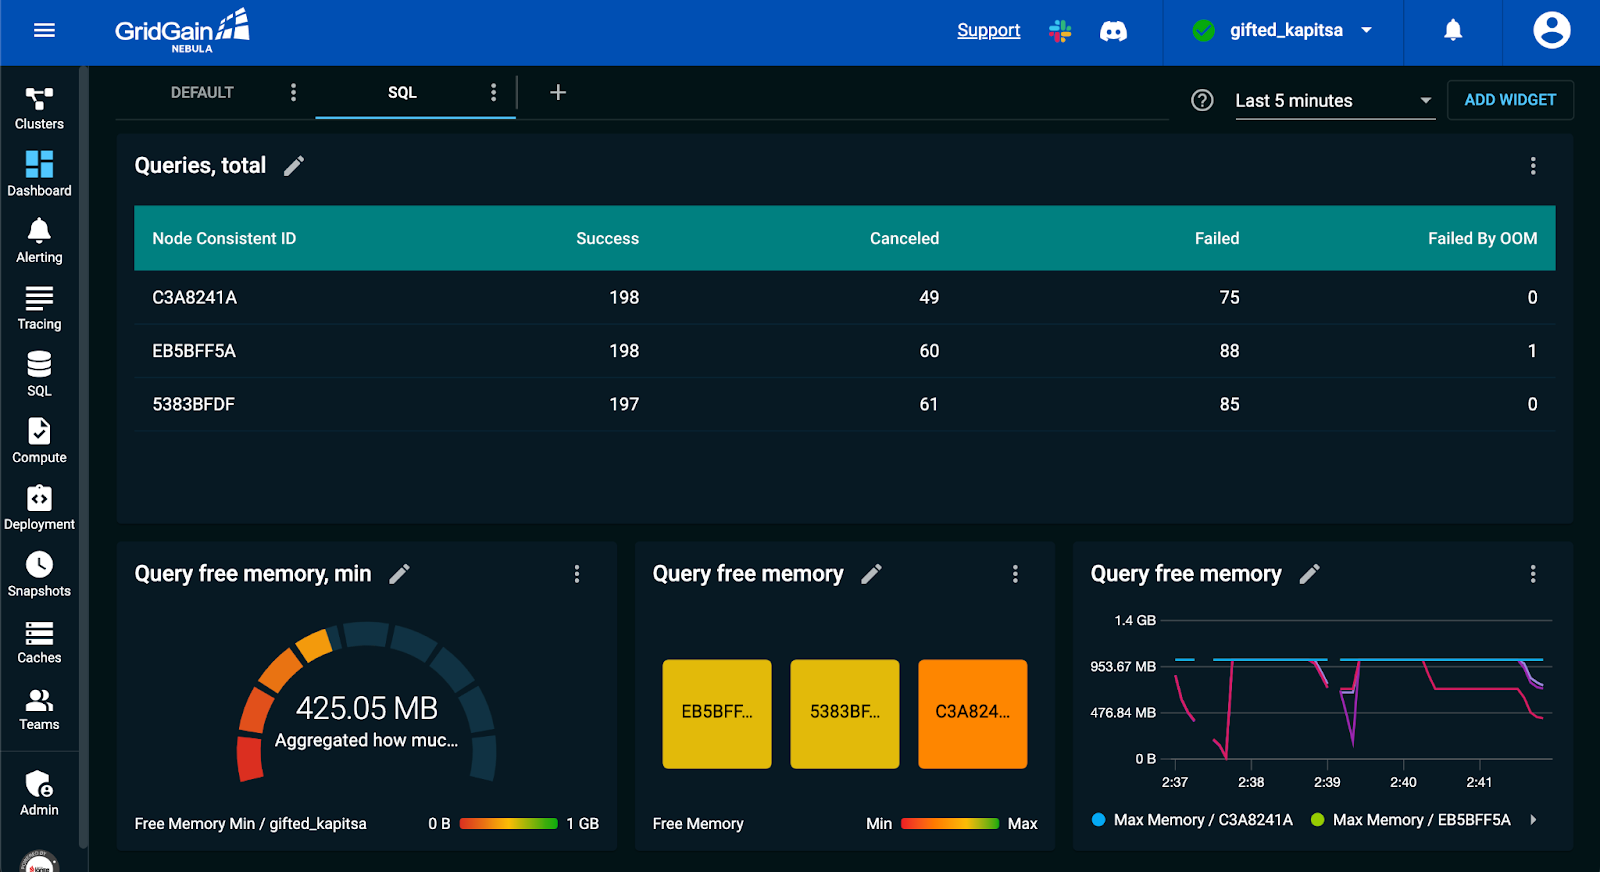
The SQL dashboard template allows an administrator to quickly analyze SQL activity in the cluster (Figure 2). The main table shows the number of queries finished successfully or abruptly. Other indicators help to visualize the most common issue with SQL execution – the memory consumption.

Figure 2. SQL Monitoring
The dashboard is useful for SQL monitoring and is also the first step in troubleshooting SQL problems. If you suspect there is a problem with query execution, you can quickly assess its magnitude and also confirm whether or not memory is the root cause of a problem.
By concurrently reporting on multiple metrics in near real time, Nebula dashboards visualize cluster health over time and draw attention to trouble areas quickly. Without Nebula, administrators can use the API and command line to access performance data. But monitoring and troubleshooting are nearly as quick or convenient as using a Nebula dashboard.
Persistence Monitoring
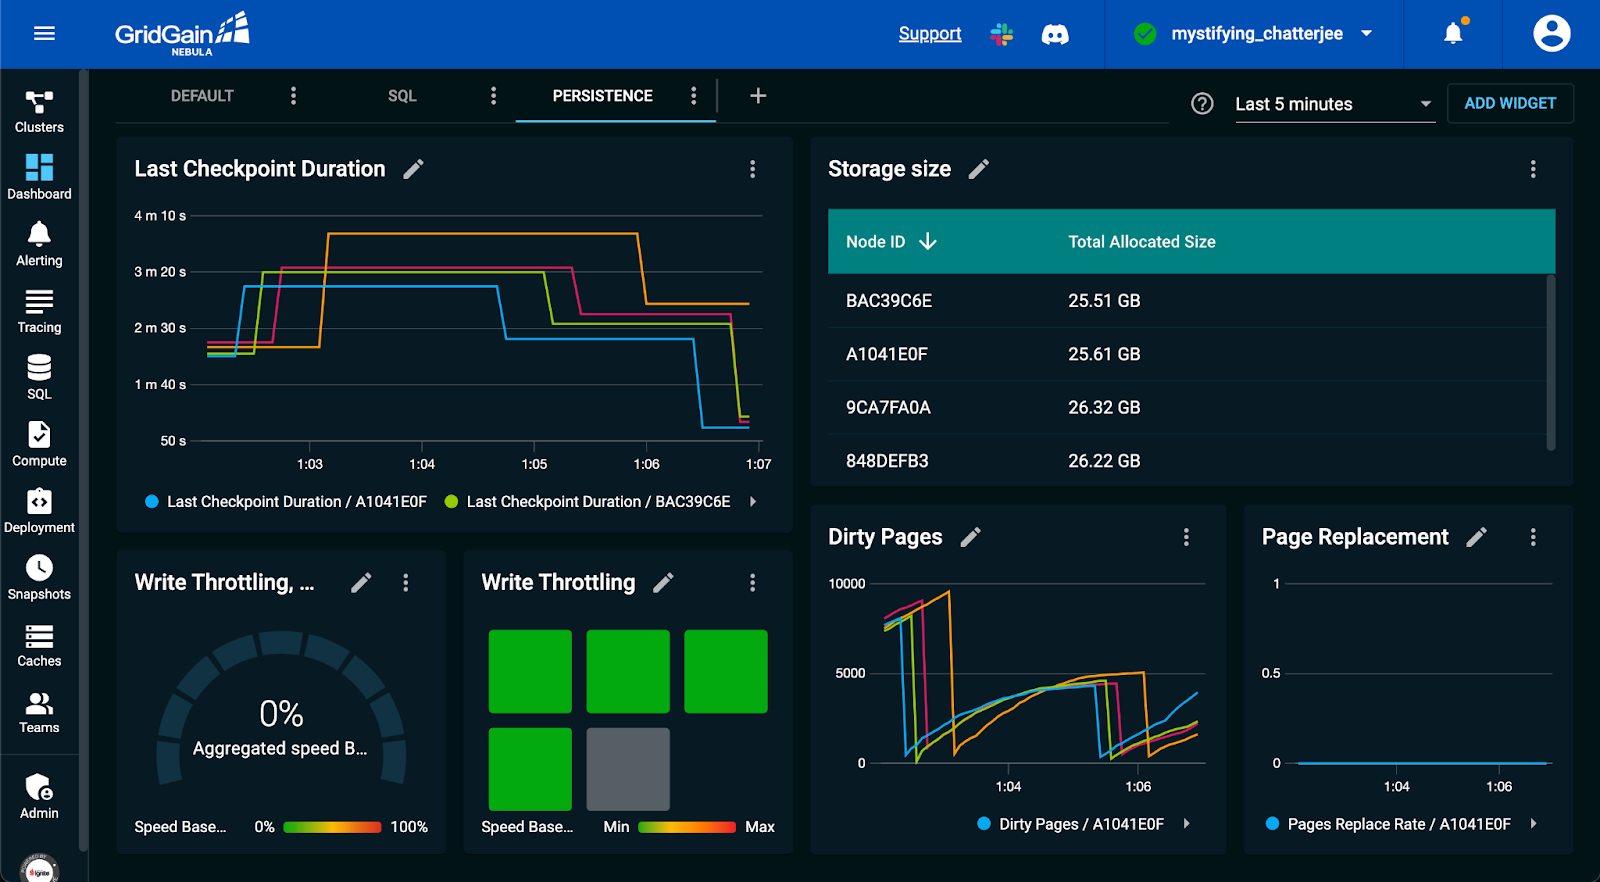
The Persistence dashboard shows the key metrics to look at to analyze persistent storage state and performance (Figure 3). Storage size, dirty pages, and checkpoint duration metrics help to understand the overall load level. Write throttling and page replacements are two of the most common causes of performance problems for Ignite native persistence. These problems can be easily identified with the dedicated metrics.

Figure 3. Persistence Monitoring
“Do I have data skews?”
“Are my load metrics stable?”
“Do I have throttling due to an overloaded disk?”
These are some of the questions that can be answered in seconds with the new Persistence dashboard, which is a great starting point for a performance analysis.
Get Started for Free
If troubleshooting performance and health of Ignite clusters is on your mind, give Nebula a try. New GridGain Nebula accounts include a $500 credit so that developers can try out all Nebula features – including SQL Monitoring and Persistence Monitoring, dashboard creation and running your application clusters in the cloud – at no charge to you.
