Below is a performance comparison between GridGain versions 9.1.1 and 8.9.20.
About the Benchmark
These performance results were obtained using the YCSB (Yahoo! Cloud Serving Benchmark) — a widely adopted framework for measuring the throughput and latency of key-value and cloud-serving data stores.
YCSB provides:
- Pre-defined core workloads that exercise different mixes of operations (read, update, insert, scan).
- Flexible workload definition for modeling application-specific access patterns.
- Client-side load generation, keeping the system under test free from load-generation overhead.
- Detailed statistical reports that summarize throughput, latency, and distribution metrics.
For more information about YCSB, visit the YCSB Wiki.
Environment Specifications
In each test, the cluster consists of a given number of server nodes and the load is generated by client benchmark drivers running on separate hosts. Each server and client resides on its own machine to eliminate resource contention.
Benchmarks were executed under the following configurations:
| Storage | Servers | Replicas |
|---|---|---|
| RAM+Disk | 2 | 1 |
| RAM+Disk | 3 | 3 |
| RAM+Disk | 5 | 1 |
| RAM+Disk | 5 | 3 |
| RAM Only | 2 | 1 |
| RAM Only | 3 | 3 |
| RAM Only | 5 | 1 |
| RAM Only | 5 | 3 |
Each host has the following hardware configuration:
| System | PowerEdge R650 |
| CPU | 32 x Intel(R) Xeon(R) Silver 4314 CPU @ 2.40GHz (2 Sockets) |
| RAM | 256Gb |
| NVMe | Dell Ent NVMe CM7 U.2 MU 1.6TB |
| SSD | 2 * 450Gb |
| LAN | Ethernet 10Gb |
| OS | Linux 6.8.12-4-pve |
| JDK | Java(TM) SE Runtime Environment (build 21.0.4+8-LTS-274) |
The YCSB workload is configured as follows:
| Client hosts | 1 |
| Threads | 16 |
| Client type | thick (GG 8), thin (GG 9) |
| Field length | 100 bytes |
| Fields count | 10 |
| Entries count | 15 millions |
| Batch size | 1000 entries |
Benchmark Results
Summary
Benchmark results reveal a significant jump in both read and write throughput with the tested configuration.
The performance lift in GridGain 9.1.1 stems from the sweeping architectural upgrades introduced in the 9.x line—most notably the revamped replication and transactional protocols, along with deep storage-level optimizations.
| Storage | Servers | Replicas | Throughput, 9.1.1 vs 8.9.20 | |
|---|---|---|---|---|
| PUT | GET | |||
| RAM+Disk | 2 | 1 | +298% | +143% |
| RAM+Disk | 3 | 3 | +324% | +89% |
| RAM+Disk | 5 | 1 | +434% | +43% |
| RAM+Disk | 5 | 3 | +438% | +51% |
| RAM Only | 2 | 1 | +348% | +145% |
| RAM Only | 3 | 3 | +356% | +119% |
| RAM Only | 5 | 1 | +441% | +50% |
| RAM Only | 5 | 3 | +439% | +67% |
Results List
Below is a table of benchmark results for each tested configuration.
"Average latency" column represents the average latency for 1 batch operation in microseconds (less is better).
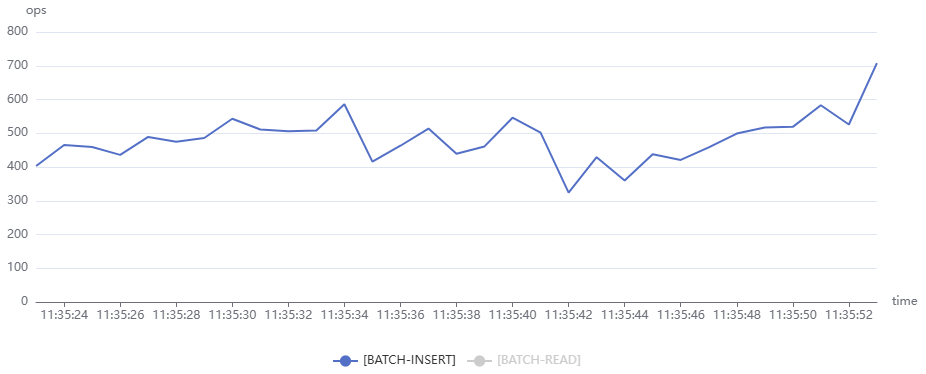
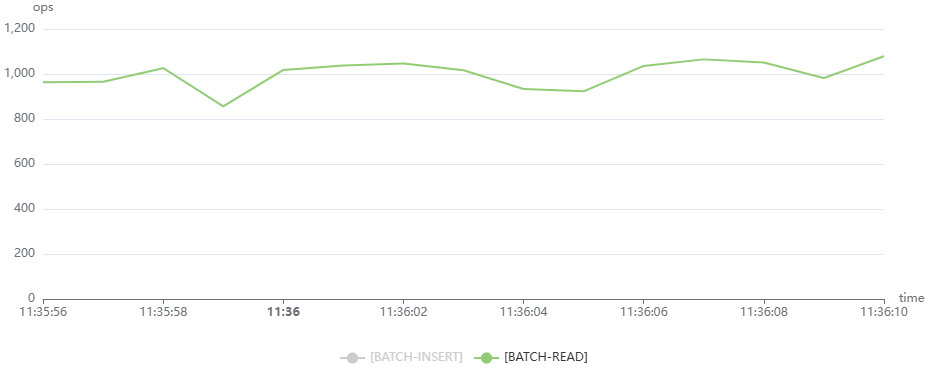
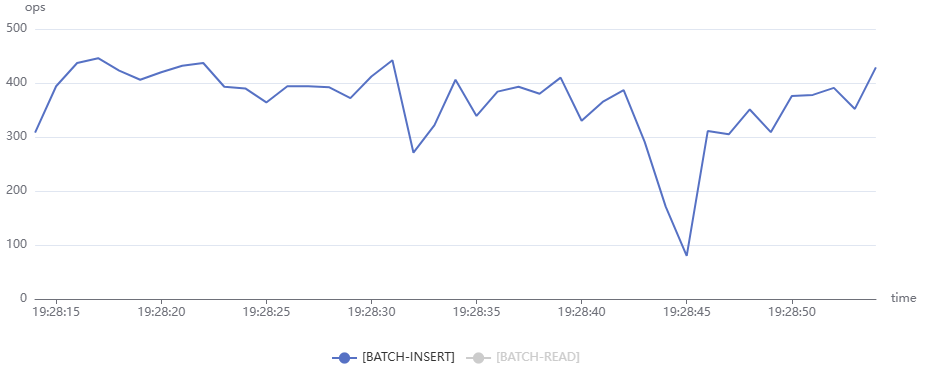
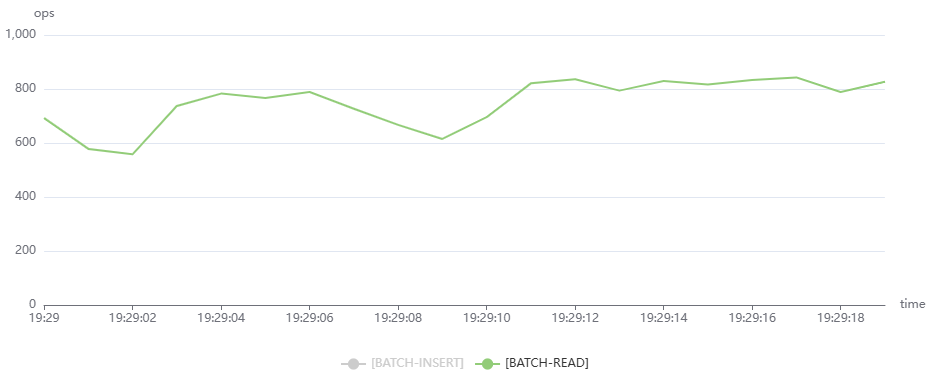
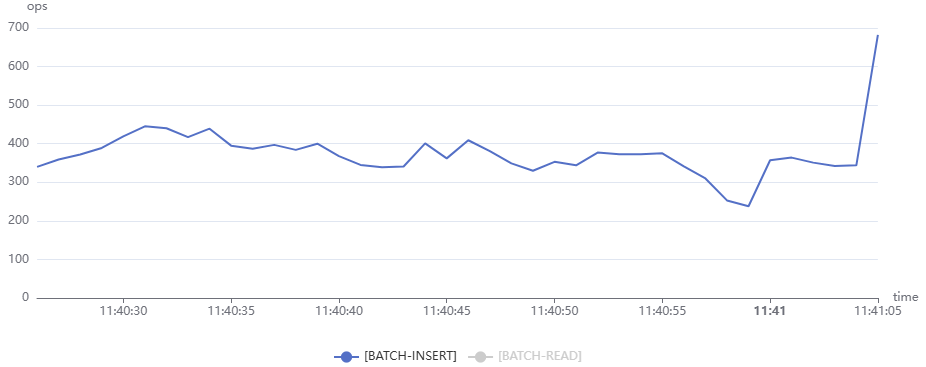
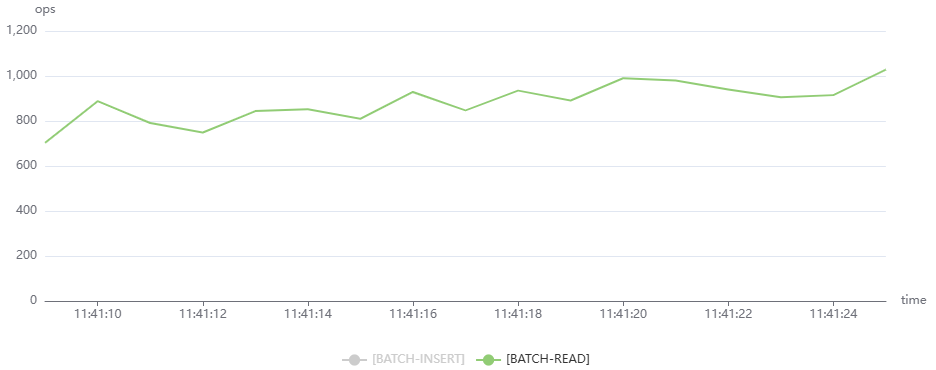
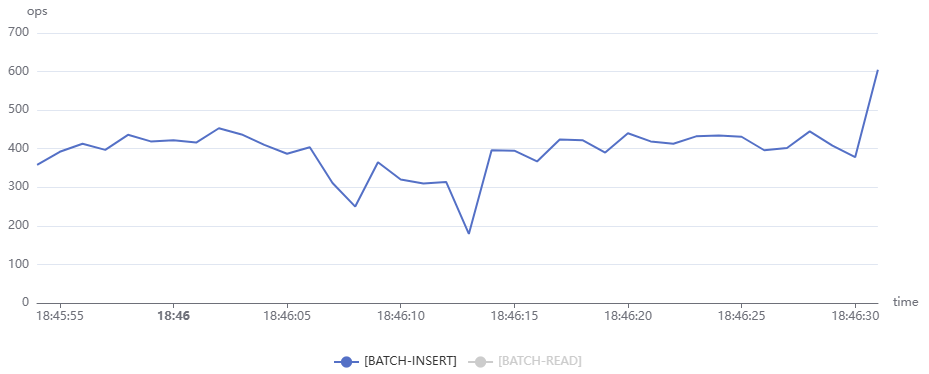
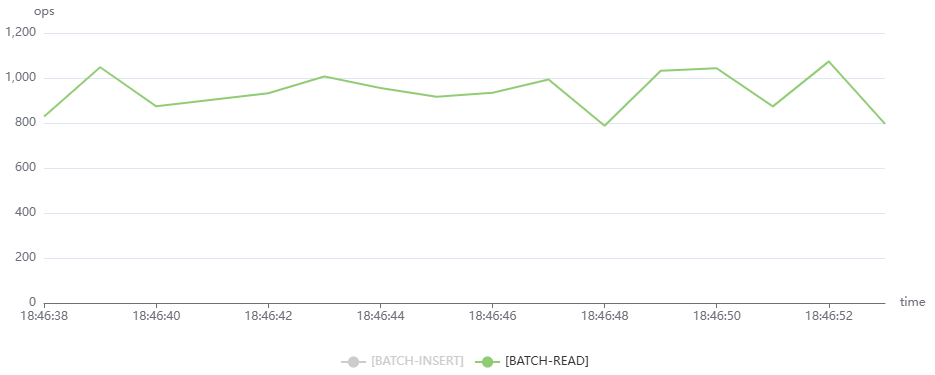
"Throughput" column represents the amount of batches processed per 1 second (more is better).
| Product version | Servers | Replicas | Storage | Operation | Average latency (μs) | Throughput, (1000 ops/s) |
|---|---|---|---|---|---|---|
| 8.9.20 | 2 | 1 | RAM+Disk | put | 165501 | 92 |
| 9.1.1 | 2 | 1 | RAM+Disk | put | 35441 | 366 |
| +367% | +298% | |||||
| 8.9.20 | 3 | 3 | RAM+Disk | put | 262476 | 59 |
| 9.1.1 | 3 | 3 | RAM+Disk | put | 56053 | 250 |
| +368% | +324% | |||||
| 8.9.20 | 2 | 1 | RAM only | put | 128223 | 117 |
| 9.1.1 | 2 | 1 | RAM only | put | 23053 | 524 |
| +456% | +348% | |||||
| 8.9.20 | 3 | 3 | RAM only | put | 173196 | 88 |
| 9.1.1 | 3 | 3 | RAM only | put | 32180 | 401 |
| +438% | +356% | |||||
| 8.9.20 | 2 | 1 | RAM+Disk | get | 50218 | 315 |
| 9.1.1 | 2 | 1 | RAM+Disk | get | 20332 | 766 |
| +147% | +143% | |||||
| 8.9.20 | 3 | 3 | RAM+Disk | get | 35282 | 446 |
| 9.1.1 | 3 | 3 | RAM+Disk | get | 18344 | 844 |
| +92% | +89% | |||||
| 8.9.20 | 2 | 1 | RAM only | get | 52053 | 304 |
| 9.1.1 | 2 | 1 | RAM only | get | 20940 | 744 |
| +149% | +145% | |||||
| 8.9.20 | 3 | 3 | RAM only | get | 36597 | 431 |
| 9.1.1 | 3 | 3 | RAM only | get | 16344 | 946 |
| +124% | +119% | |||||
| 8.9.20 | 5 | 1 | RAM+Disk | put | 140340 | 108 |
| 9.1.1 | 5 | 1 | RAM+Disk | put | 19664 | 577 |
| +614% | +434% | |||||
| 8.9.20 | 5 | 3 | RAM+Disk | put | 214742 | 71 |
| 9.1.1 | 5 | 3 | RAM+Disk | put | 33908 | 382 |
| +533% | +438% | |||||
| 8.9.20 | 5 | 1 | RAM only | put | 130110 | 116 |
| 9.1.1 | 5 | 1 | RAM only | put | 17561 | 628 |
| +641% | +441% | |||||
| 8.9.20 | 5 | 3 | RAM only | put | 164566 | 92 |
| 9.1.1 | 5 | 3 | RAM only | put | 23973 | 496 |
| +586% | +439% | |||||
| 8.9.20 | 5 | 1 | RAM+Disk | get | 22919 | 684 |
| 9.1.1 | 5 | 1 | RAM+Disk | get | 15805 | 980 |
| +45% | +43% | |||||
| 8.9.20 | 5 | 3 | RAM+Disk | get | 25365 | 619 |
| 9.1.1 | 5 | 3 | RAM+Disk | get | 16668 | 932 |
| +52% | +51% | |||||
| 8.9.20 | 5 | 1 | RAM only | get | 23379 | 670 |
| 9.1.1 | 5 | 1 | RAM only | get | 15318 | 1005 |
| +53% | +50% | |||||
| 8.9.20 | 5 | 3 | RAM only | get | 25446 | 615 |
| 9.1.1 | 5 | 3 | RAM only | get | 15085 | 1024 |
| +69% | +67% | |||||
Details Per Configuration
RAM+Disk, 2 Servers, 1 Replica
| Product | Storage engine | Operation | Latency (μs) | Throughput, (1000 ops/s) | ||
|---|---|---|---|---|---|---|
| Average | 95th % | 99th % | ||||
| 8.9.20 | aipersist | put | 165501.2 | 245247 | 317183 | 92 |
| 9.1.1 | aipersist | put | 35441.0 | 70783 | 112639 | 366 |
| +367% | +246% | +182% | +298% | |||
| 8.9.20 | aipersist | get | 50218.2 | 52639 | 55071 | 315 |
| 9.1.1 | aipersist | get | 20331.6 | 33663 | 49887 | 766 |
| +147% | +56% | +10% | +143% | |||
RAM+Disk, 5 Servers, 1 Replica
| Product | Storage engine | Operation | Latency (μs) | Throughput, (1000 ops/s) | ||
|---|---|---|---|---|---|---|
| Average | 95th % | 99th % | ||||
| 8.9.20 | aipersist | put | 140339.8 | 170751.0 | 201983.0 | 108 |
| 9.1.1 | aipersist | put | 19664.1 | 32927.0 | 61375.0 | 577 |
|
|
|
|
+614% | +419% | +229% | +434% |
| 8.9.20 | aipersist | get | 22919.4 | 25759.0 | 28383.0 | 684 |
| 9.1.1 | aipersist | get | 15804.8 | 26575.0 | 34783.0 | 980 |
|
|
|
|
+45% | -3% | -23% | +43% |
RAM Only, 2 Servers, 1 Replica
| Product | Storage engine | Operation | Latency (μs) | Throughput, (1000 ops/s) | ||
|---|---|---|---|---|---|---|
| Average | 95th % | 99th % | ||||
| 8.9.20 | aimem | put | 128223.0 | 167807 | 206591 | 117 |
| 9.1.1 | aimem | put | 23052.9 | 61759 | 91647 | 524 |
|
|
|
|
+456% | +172% | +125% | +348% |
| 8.9.20 | aimem | get | 52052.6 | 55007 | 58527 | 304 |
| 9.1.1 | aimem | get | 20940.0 | 39295 | 55711 | 744 |
|
|
|
|
+149% | +40% | +5% | +145% |
RAM Only, 5 Servers, 1 Replica
| Product | Storage engine | Operation | Latency (μs) | Throughput, (1000 ops/s) | ||
|---|---|---|---|---|---|---|
| Average | 95th % | 99th % | ||||
| 8.9.20 | aimem | put | 130110.2 | 151679.0 | 165887.0 | 116 |
| 9.1.1 | aimem | put | 17561.3 | 35487.0 | 72063.0 | 628.0 |
|
|
|
|
+641% | +327% | +130% | +441% |
| 8.9.20 | aimem | get | 23378.6 | 25151.0 | 28655.0 | 670 |
| 9.1.1 | aimem | get | 15317.6 | 25839.0 | 43679.0 | 1005 |
|
|
|
|
+53% | -3% | -52% | +50% |
RAM+Disk, 3 Servers, 3 Replicas
| Product | Storage engine | Operation | Latency (μs) | Throughput, (1000 ops/s) | ||
|---|---|---|---|---|---|---|
| Average | 95th % | 99th % | ||||
| 8.9.20 | aipersist | put | 262476.2 | 397567 | 541183 | 59 |
| 9.1.1 | aipersist | put | 56053.3 | 92671 | 147455 | 250 |
|
|
|
|
+368% | +329% | +267% | +324% |
| 8.9.20 | aipersist | get | 35281.6 | 37631 | 42207 | 446 |
| 9.1.1 | aipersist | get | 18344.4 | 32031 | 59487 | 844 |
|
|
|
|
+92% | +17% | -41% | +89% |
RAM+Disk, 5 Servers, 3 Replicas
| Product | Storage engine | Operation | Latency (μs) | Throughput, (1000 ops/s) | ||
|---|---|---|---|---|---|---|
| Average | 95th % | 99th % | ||||
| 8.9.20 | aipersist | put | 214742.3 | 293631.0 | 447743.0 | 71 |
| 9.1.1 | aipersist | put | 33907.8 | 58783.0 | 76543.0 | 382 |
|
|
|
|
+533% | +400% | +485% | +438% |
| 8.9.20 | aipersist | get | 25364.9 | 28063.0 | 30799.0 | 619 |
| 9.1.1 | aipersist | get | 16668.2 | 29551.0 | 54687.0 | 932 |
|
|
|
|
+52% | -5% | -78% | +51% |
RAM Only, 3 Servers, 3 Replicas
| Product | Storage engine | Operation | Latency (μs) | Throughput, (1000 ops/s) | ||
|---|---|---|---|---|---|---|
| Average | 95th % | 99th % | ||||
| 8.9.20 | aimem | put | 173196.0 | 224127.0 | 265471.0 | 88 |
| 9.1.1 | aimem | put | 32180.2 | 70655.0 | 119871.0 | 401 |
|
|
|
|
+438% | +217% | +121% | +356% |
| 8.9.20 | aimem | get | 36596.8 | 38879.0 | 43167.0 | 431 |
| 9.1.1 | aimem | get | 16343.6 | 25983.0 | 51295.0 | 946 |
|
|
|
|
+124% | +50% | -19% | +119% |
RAM Only, 5 Servers, 3 Replicas
| Product | Storage engine | Operation | Latency (μs) | Throughput, (1000 ops/s) | ||
|---|---|---|---|---|---|---|
| Average | 95th % | 99th % | ||||
| 8.9.20 | aimem | put | 164565.7 | 198655.0 | 222847.0 | 92 |
| 9.1.1 | aimem | put | 23973.2 | 60383.0 | 101183.0 | 496 |
|
|
|
|
+586% | +229% | +120% | +439% |
| 8.9.20 | aimem | get | 25446.4 | 27983.0 | 30383.0 | 615 |
| 9.1.1 | aimem | get | 15085.3 | 25311.0 | 36031.0 | 1024 |
|
|
|
|
+69% | +11% | -19% | +67% |