Monitoring GridGain Storage Usage
GridGain stores application data both in memory and, when persistence is enabled, on disk. To keep a cluster healthy, you need to monitor memory pressure, disk usage, write-ahead log (WAL) growth, and checkpoint duration.
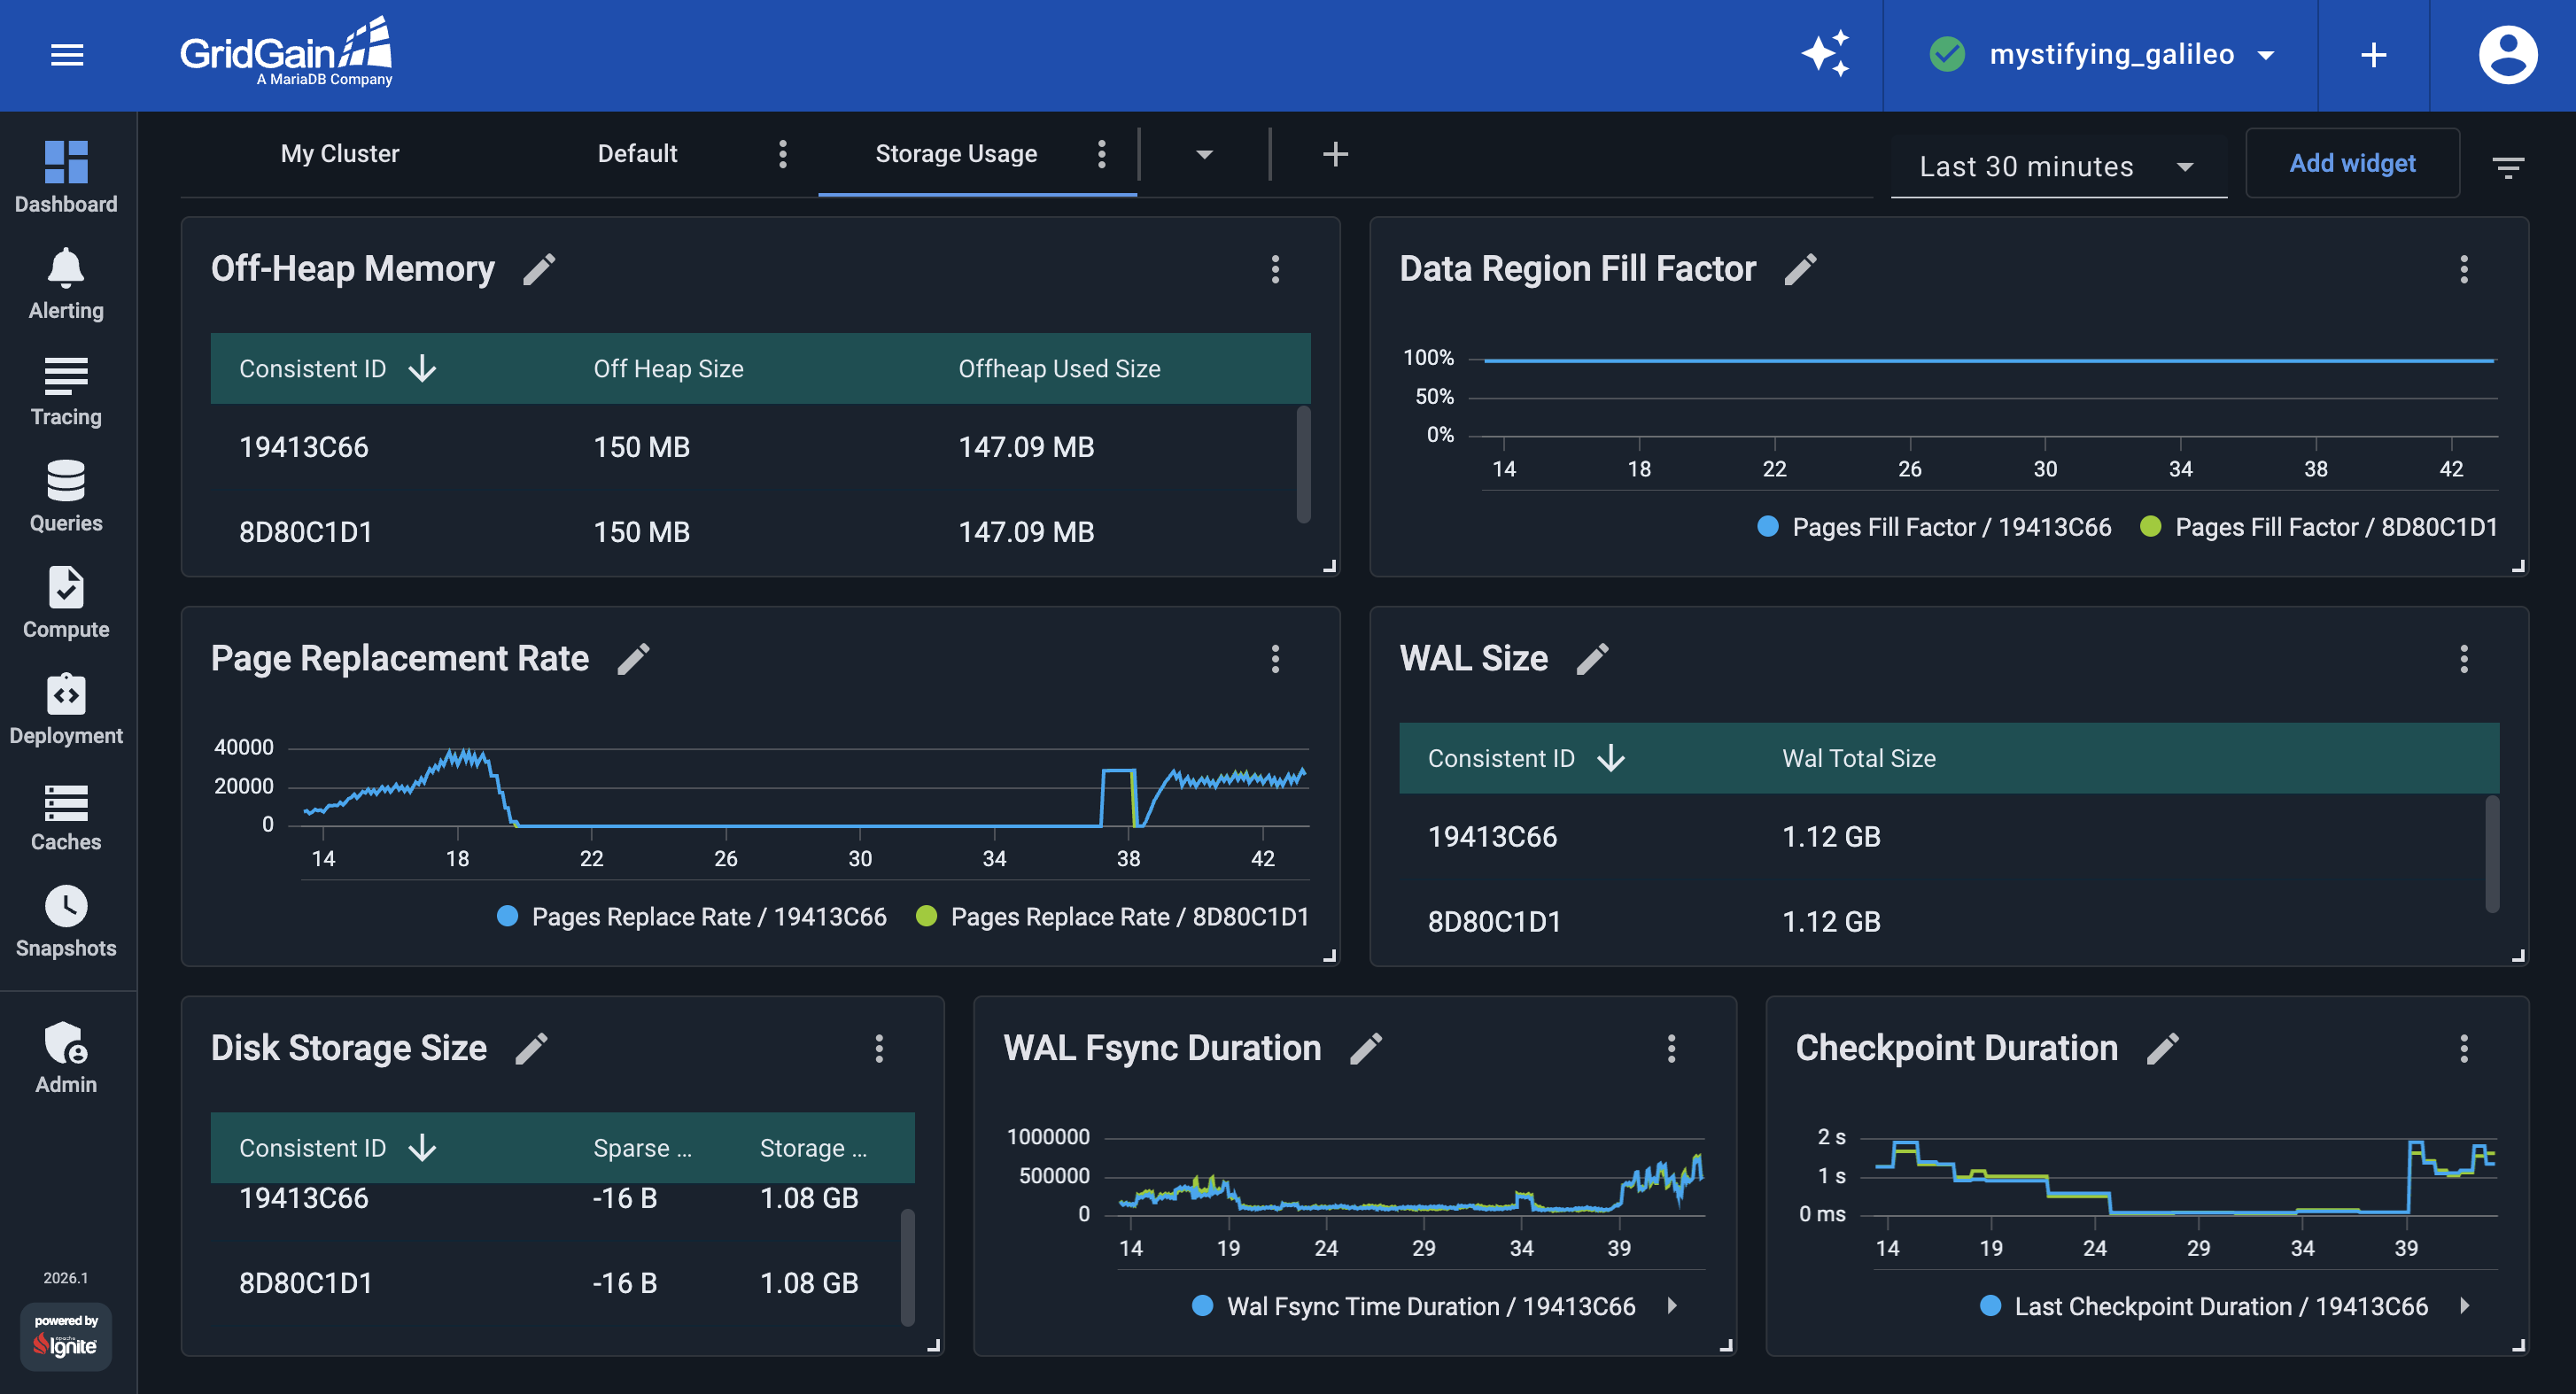
In this part of the tutorial, you create a GridGain Control Center dashboard that tracks memory and disk consumption, so you can detect storage pressure before it affects production performance. By the end, your Storage Usage dashboard should look like the following:
A storage dashboard is useful only if it answers the questions you need to ask in production. The widgets below are grouped around three questions:
-
Is memory filling up? — off-heap usage, data region fill factor, and page replacement.
-
Is disk filling up? — disk space used by persisted records and storage files.
-
Is the write path keeping up? — WAL size, WAL fsync duration, and checkpoint duration.
Create the Storage Usage Dashboard
Start by creating an empty dashboard to hold the widgets:
-
Open the Dashboard screen.
-
Click the
➕icon in the tab bar and create an empty dashboard. Open the new tab’s⋮menu, select Rename, and name itStorage Usage.
Add Monitoring Widgets
First,
add a widget
to your Storage Usage dashboard and choose its type:
-
Use a Metrics (table) widget when you want to read a value at a glance, such as a current size against its limit.
-
Use a Metrics (chart) widget when you want to watch how a value trends over time, such as a rate or a duration.
Then, in the widget creation dialog, search for the metric by name and select it. A single widget can show more than one
metric, so related metrics, such as used against total, can share one widget. Once the widget is created, open its
⋮ menu, select Rename, and give it the name suggested in each section below.
For more on resizing and arranging widgets, see the Control Center widget documentation.
Monitor Off-Heap Memory
GridGain stores application records and indexes in memory regions outside the Java heap. These regions are managed by GridGain rather than by the Java garbage collector and are usually called off-heap memory.
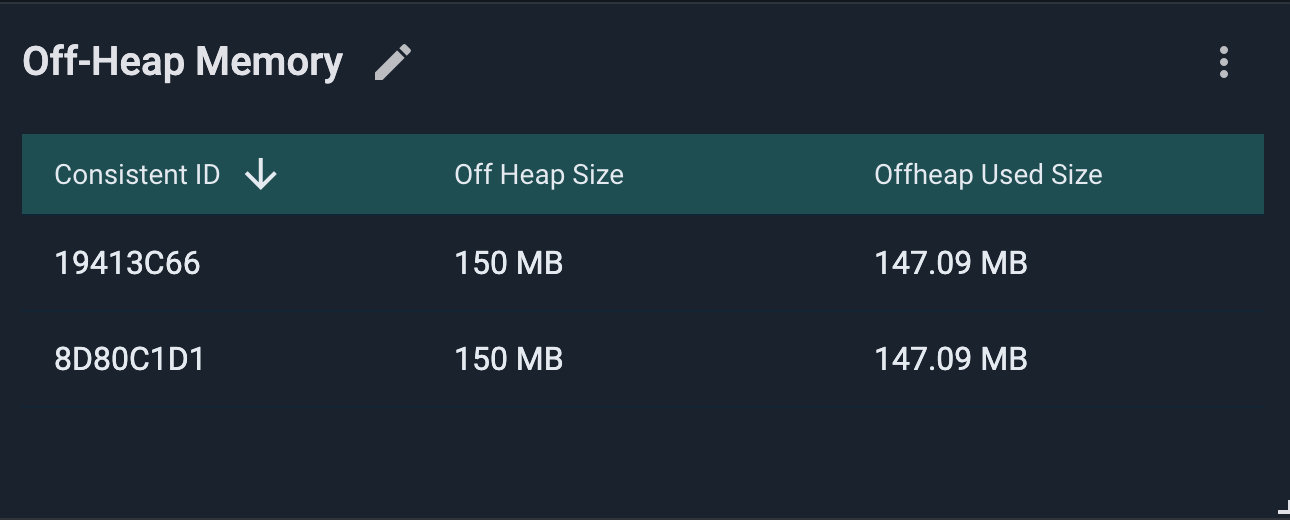
Add a Metrics (table) widget with two metrics to read used against total:
-
io.dataregion.default.OffheapUsedSize: the off-heap memory in use, which grows as the application loads data. -
io.dataregion.default.OffHeapSize: the region’s configured capacity.
Rename the widget to Off-Heap Memory.
Monitor Memory Pressure
The off-heap widget shows how much memory is in use, but not how close the region is to full or whether GridGain has already started replacing pages to make room. These are the signals that usually precede latency spikes in production: once the region fills, GridGain must replace pages, and data that was previously served from memory may need to be loaded from disk.
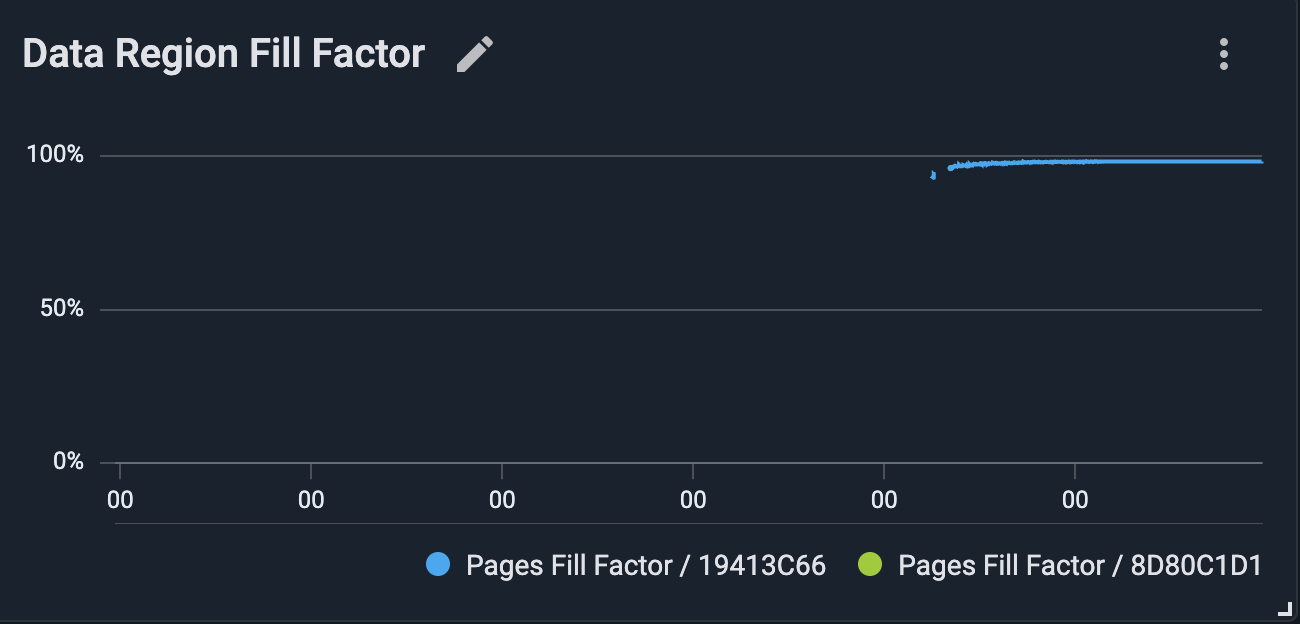
Add a Metrics (chart) widget on io.dataregion.default.PagesFillFactor to track how full the data region is, and
rename it to Data Region Fill Factor.
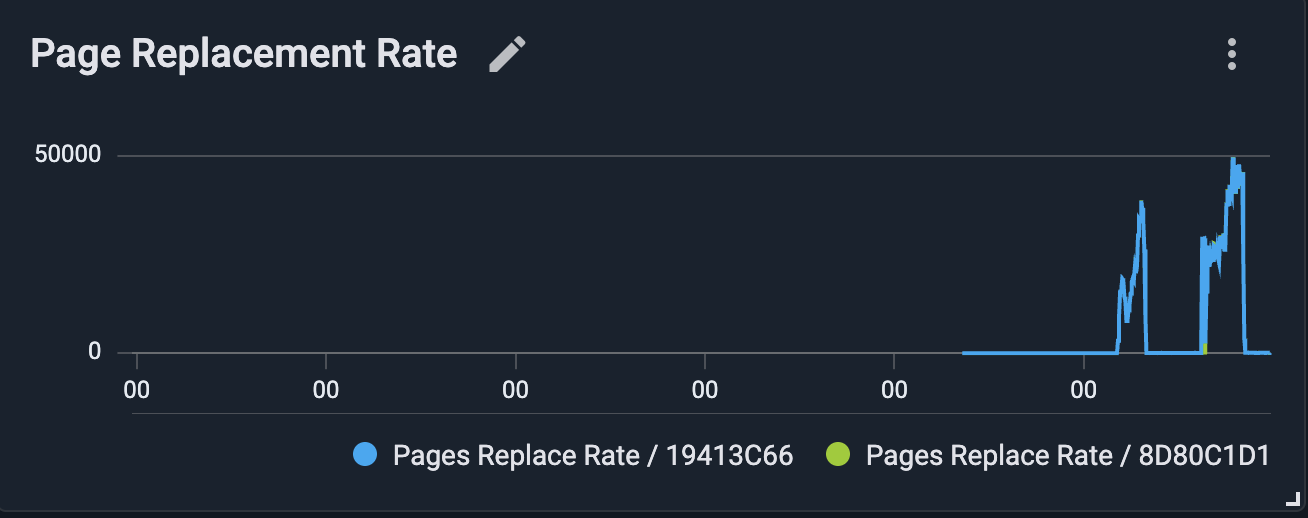
Then add a Metrics (chart) widget on io.dataregion.default.PagesReplaceRate and rename it to Page Replacement Rate.
A sustained non-zero rate indicates that the data region is undersized for the working set and that GridGain is actively
replacing pages, which can increase read latency.
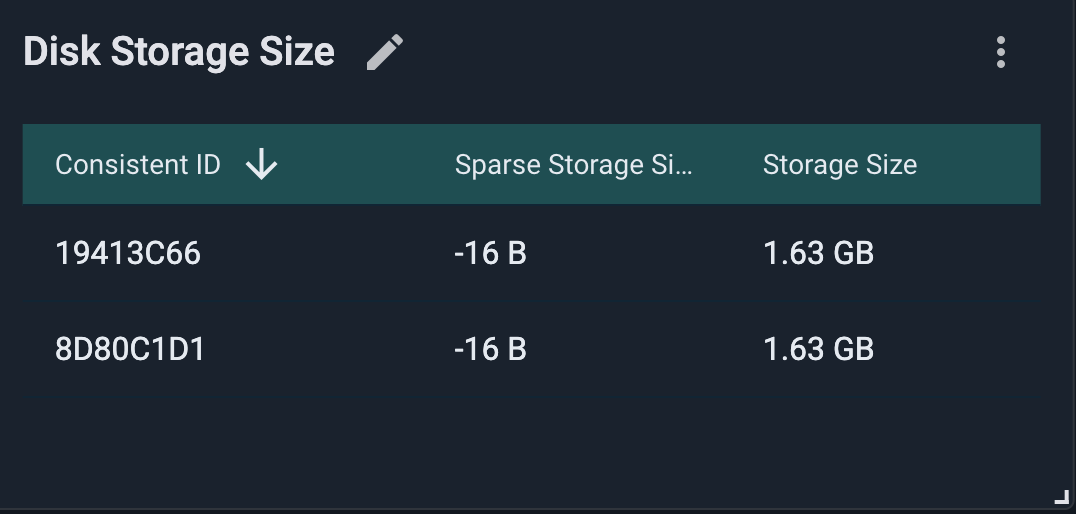
Track Disk Storage Size
If GridGain native persistence is enabled for your cluster, GridGain persists application data to disk.
Add a Metrics (table) widget with two metrics to compare logical size against the real disk footprint:
-
io.datastorage.StorageSize: the logical size of the storage files. -
io.datastorage.SparseStorageSize: the actual space they occupy on disk, which can be smaller because the files are sparse.
Rename the widget to Disk Storage Size.
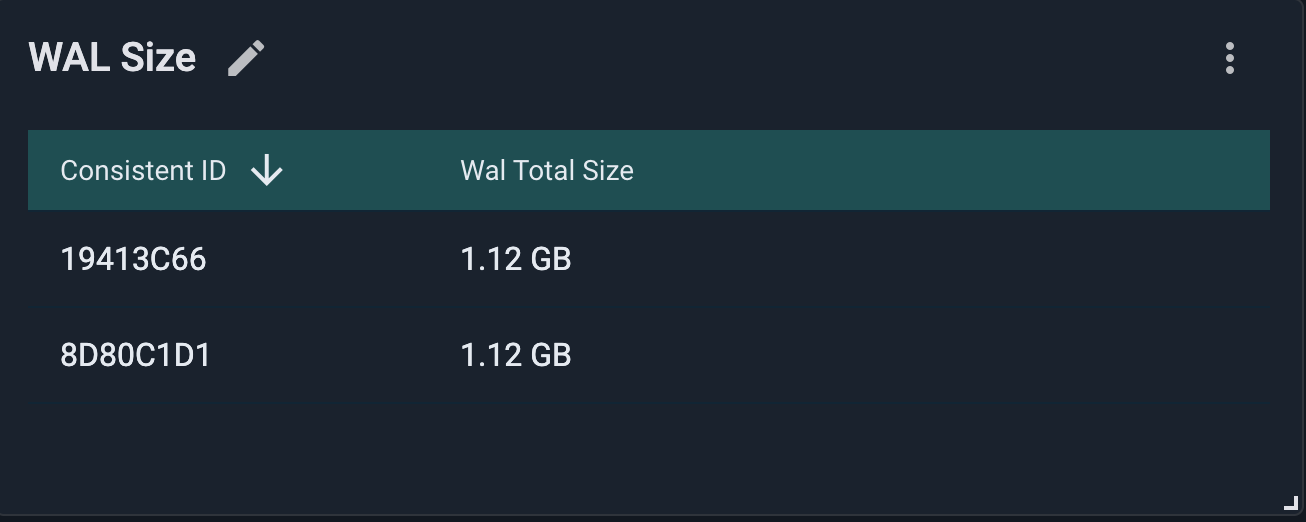
Monitor WAL Size
GridGain does not write every update directly to its final location in storage files because random disk updates are expensive. Instead, changes are appended to the WAL first and later written to storage files during checkpointing.
Add a Metrics (table) widget on io.datastorage.WalTotalSize and rename it to WAL Size.
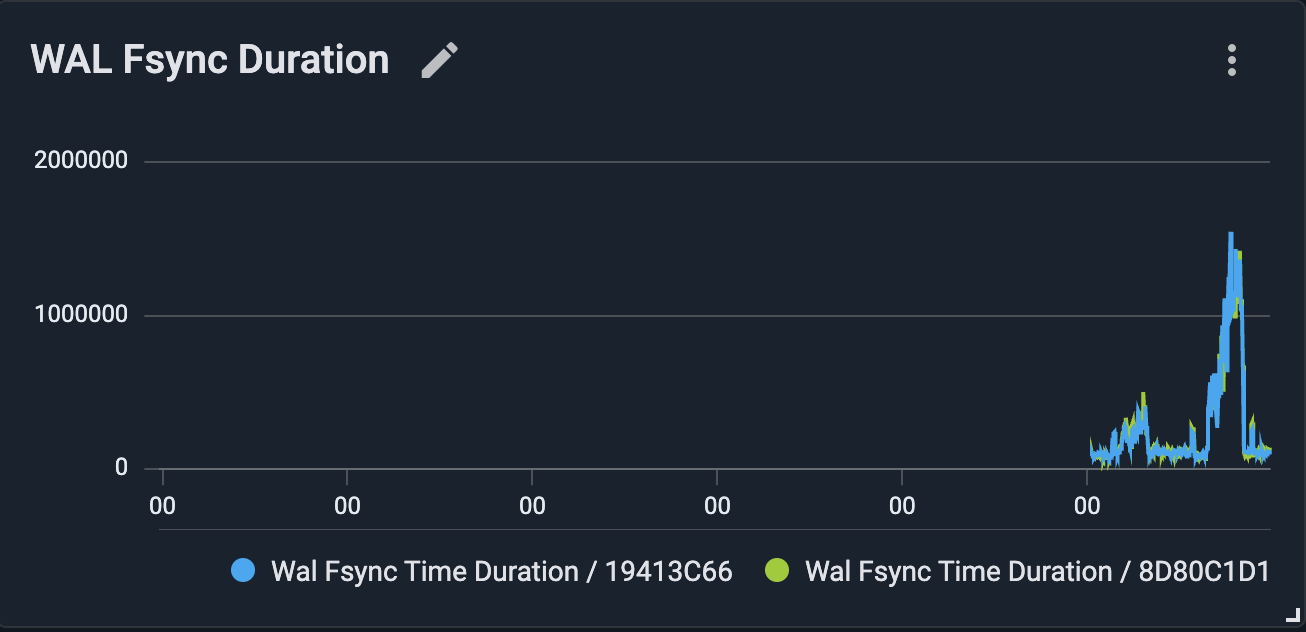
Watch WAL Synchronization Duration
GridGain appends changes to the WAL for every data update, and the operating system (OS) must fsync those changes to disk according to the configured persistence mode. If GridGain or the OS spends significant time in the fsync stage, write latency can increase, and you might need to apply WAL-related tuning.
Add a Metrics (chart) widget on io.datastorage.WalFsyncTimeDuration and rename it to WAL Fsync Duration.
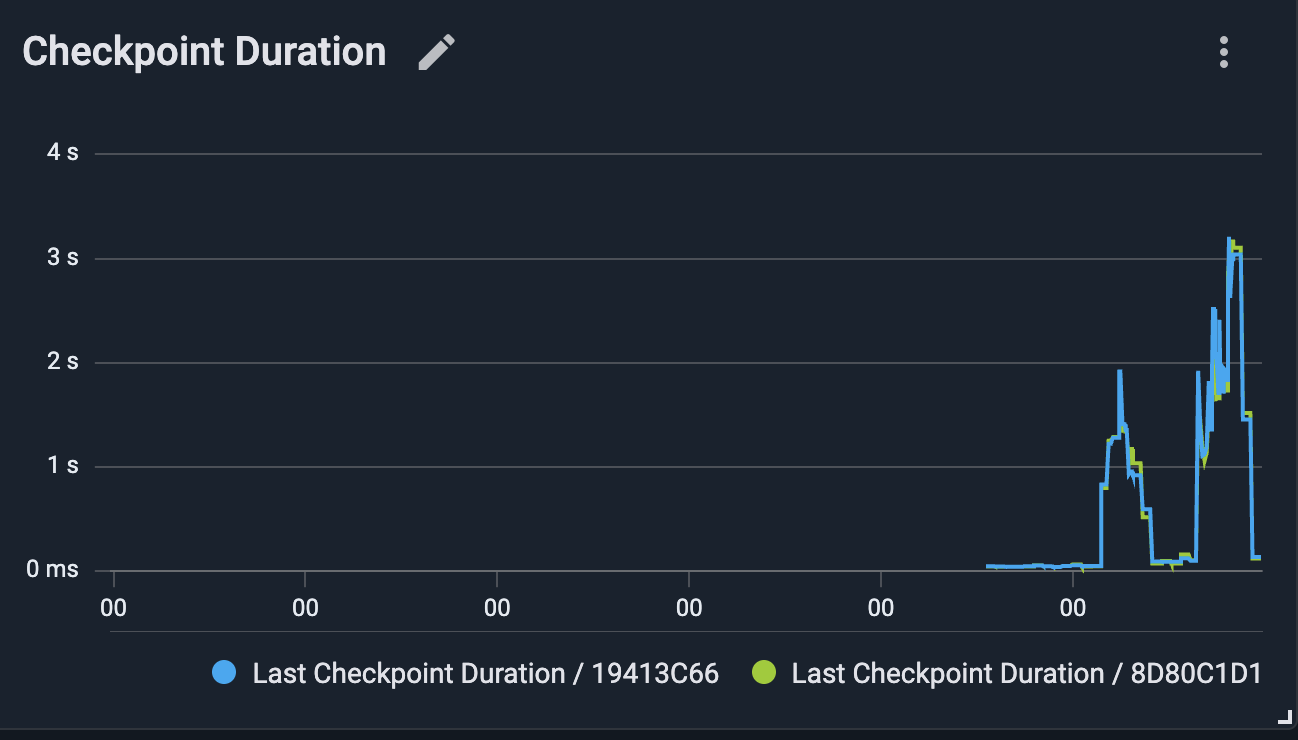
Watch Checkpointing Duration
Checkpointing is the process of writing dirty pages from memory to storage files on disk. Long checkpoint durations can indicate that the disk subsystem or checkpoint configuration is not keeping up with the write load and may call for disk tuning.
Finally, add a Metrics (chart) widget on io.datastorage.LastCheckpointDuration and rename it to Checkpointing Duration.
When You Need to Investigate Further
The widgets above are the signals to watch routinely. When one of them looks off, these metrics help you find the cause; add them to this dashboard (or a separate one) as needed:
-
WAL Throughput —
io.datastorage.WalWritingRate(addio.datastorage.WalArchiveSegmentsfor the archive backlog): how hard the cluster is writing, useful when WAL size or fsync time rises. -
Dirty Pages —
io.dataregion.default.DirtyPages: shows checkpoint pressure in more detail. A value that does not drop after checkpoints can indicate that checkpoints are not keeping up with the write rate. -
Checkpoint Distribution — a
Metrics (histogram)widget onio.datastorage.CheckpointHistogram, paired withio.datastorage.LastCheckpointFsyncDurationandLastCheckpointPagesWriteDurationto see which checkpoint phase is slow.
Review Your Storage Usage Dashboard
With every widget in place, your Storage Usage dashboard now answers the three questions the page opened with:
-
Is memory filling up? — Off-Heap Memory, Data Region Fill Factor, and Page Replacement Rate.
-
Is disk filling up? — Disk Storage Size.
-
Is the write path keeping up? — WAL Size, WAL Fsync Duration, and Checkpointing Duration.
Drag the widgets to arrange them so the signals you watch most often sit at the top. For more on resizing, rearranging, and editing widgets, see the Control Center widget documentation.
What’s Next
This dashboard shows what each node stores. In the next part, you build a second dashboard for the cluster-wide view: node membership, per-node JVM health, and data distribution across nodes.
© 2026 GridGain Systems, Inc. All Rights Reserved. Privacy Policy | Legal Notices. GridGain® is a registered trademark of GridGain Systems, Inc.
Apache, Apache Ignite, the Apache feather and the Apache Ignite logo are either registered trademarks or trademarks of The Apache Software Foundation.