
Overview
The task of monitoring complex distributed systems can be a headache, from the configuration and updating point of view and from the performance point of view. The easiest way to avoid problems is to prevent them at the design stage. In this post, we describe how to implement monitoring of a complex distributed system by using Zabbix as the monitoring tool and Apache Ignite as the distributed system.
Problems to avoid:
- Performance: When multiple metrics are processed from multiple nodes, the monitoring system might not be able to cope with the incoming metric stream.
- Impact on system performance: Metric collection might consume an unacceptable amount of system resources.
- Redundant complexity: You need a monitoring system that you can trust.The more complex the solution, the higher the probability of failure, especially when changes occur.
Guidelines for building a monitoring system:
- Remember that simpler is better.
- Reduce the load on the metrics collection server. If there are a large number of nodes, it is better to perform complex calculations on the nodes and send ready-made values to the server.
- Reduce the frequency of collecting metrics, especially the collection of "heavy" metrics. Automate regularly performed actions. As the number of nodes increases, manual actions inevitably lead to errors.
Using these guidelines, we will create a template and configure monitoring for the test cluster. The resulting template is available in the Zabbix repository.
Template Creation
To build your dream monitoring system, you need a good understanding of the product that you want to track and evaluate.
Apache Ignite is an in-memory computing platform that is used as a cache, a distributed computing system, and a database. To learn about Apache Ignite, see the official documentation. The key external indicators (KPIs) of system performance constitute a relatively standard set:
- CPU load
- RAM utilization
- Disc utilization, when persistence is used
- Network
Zabbix contains templates for monitoring these metrics and for monitoring extended metrics, like disc utilization. Also, ready-made solutions are available in the Zabbix repository; for example, a template for monitoring a Linux disk is available.
For distributed systems, external indicators identify problems after incidents occur; for example, after a hardware failure or after the system becomes unavailable. To identify potential problems (before an incident occurs), internal indicators are needed. At the time of this writing, there are no ready-made, internal-indicator templates for Apache Ignite, so we will write our own internal-indicator templates.
Because Apache Ignite is written in Java, JMX will be our primary monitoring method. When we download and run Apache Ignite, the JMX port opens on the first free port between 49112 and 65535. For monitoring, this approach is not appropriate because, typically, the port is configured in advance and cannot be detected automatically. When you familiarize yourself with the startup script, it becomes clear that, to specify the required port, you use the IGNITE_JMX_PORT environment variable (for Ignite versions earlier than 2.l0) or the IGNITE_JMX_PORT (for Ignite versions 2.10 and later). Thus, by running the command export IGNITE_JMX_PORT=49112, you open jmx-port as follows:
export JVM_OPTS="-Dcom.sun.management.jmxremote -Dcom.sun.management.jmxremote.port=49112 -Dcom.sun.management.jmxremote.authenticate=false -Dcom.sun.management.jmxremote.ssl=false" )
After the node starts, we can access the JMX on the static port that we specified.
Now, knowing the port, we can use the standard JDK tool (jconsole) to connect to the application and see what is inside. Almost all metrics and objects provide descriptions of what they do.
The feature that needs our attention is that, by default, the path to mbean contains a classloader that changes after each restart on the node. This feature allows several Ignite instances to be started within one JVM and, thus, avoids metrics conflicts. However, because ot the autogenerated classloader, Zabbix detects the metrics after each restart. We can solve this problem by adding the JMX option -DIGNITE_MBEAN_APPEND_CLASS_LOADER_ID=false. This option removes the classloader from the path.

Apache Ignite is open-source software. So if you think that some functionality should work differently, you can participate in development. I have created the task in Apache Ignite JIRA.
When the classloader is removed from the path and the node is started, the metric tree looks like the following:
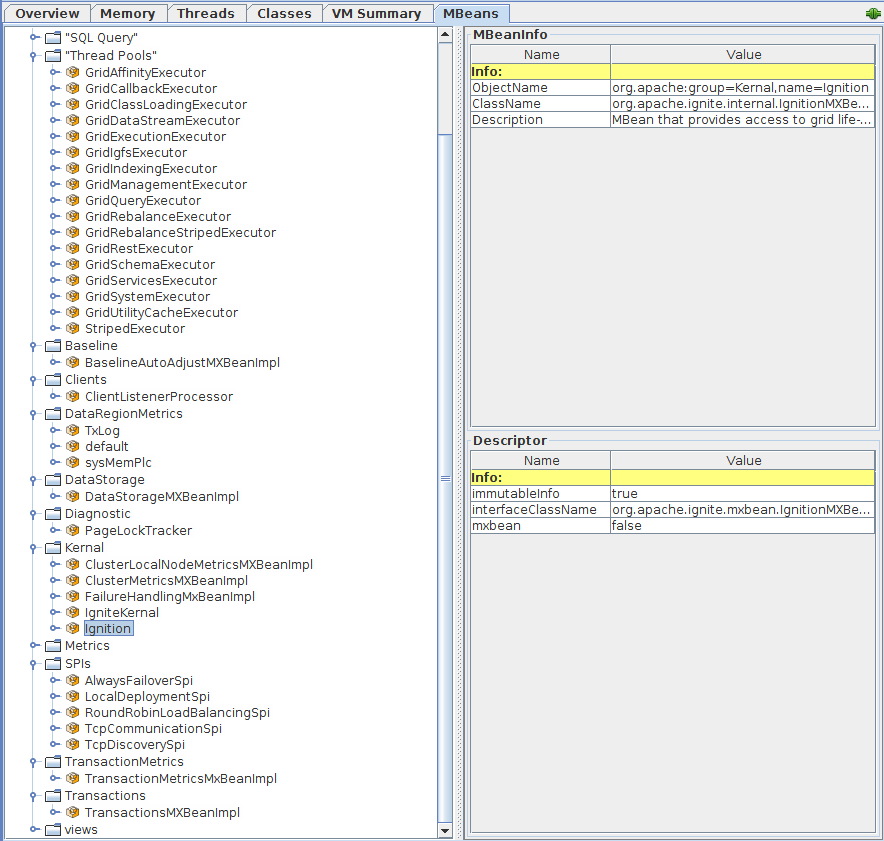
To facilitate the process of adding and changing metrics, we first determine which objects have similar entities. In Java, this task is usually accomplished via an interface implementation. In our case, when you examine, for example, metrics in the section IThread pool, you see that all objects implement the ThreadPoolMXBean interface.

The fact that most interests us is that each object has one basic set of metrics. Therefore, In regard to Zabbix templates, we can configure a discovery rule for the metrics. Then, based on our rule, the monitoring server detects all identical objects and applies the template to them.
For example, a rule to find all instances of dataRegion looks like the following:
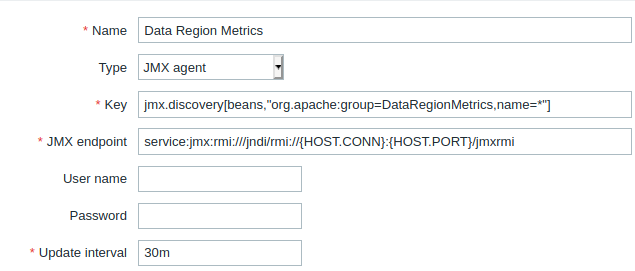
Zabbix sets the value of {HOST.CONN}:{HOST.PORT} to the address at which the host is available, the template is applied, and the number of the JMX port is specified.
If it becomes necessary to debug the JMX discovery, you can use the zabbix_get command. For example, you issue the following request:
zabbix_get -s localhost -p 10052 -k '{"request":"java gateway jmx","jmx_endpoint":"service:jmx:rmi:///jndi/rmi://HOST:49112/jmxrmi","keys":["jmx.discovery[beans,\"org.apache:group=DataRegionMetrics,name=*\"]"]}'
And, in response to your request, you receive the following result:
{
"{#JMXDOMAIN}":"org.apache",
"{#JMXOBJ}":"org.apache:group=DataRegionMetrics,name=sysMemPlc",
"{#JMXNAME}":"sysMemPlc",
"{#JMXGROUP}":"DataRegionMetrics"
},
{
"{#JMXDOMAIN}":"org.apache",
"{#JMXOBJ}":"org.apache:group=DataRegionMetrics,name=default",
"{#JMXNAME}":"default",
"{#JMXGROUP}":"DataRegionMetrics"
},
{
"{#JMXDOMAIN}":"org.apache",
"{#JMXOBJ}":"org.apache:group=DataRegionMetrics,name=TxLog",
"{#JMXNAME}":"TxLog",
"{#JMXGROUP}":"DataRegionMetrics"
}
An example of a metric template:
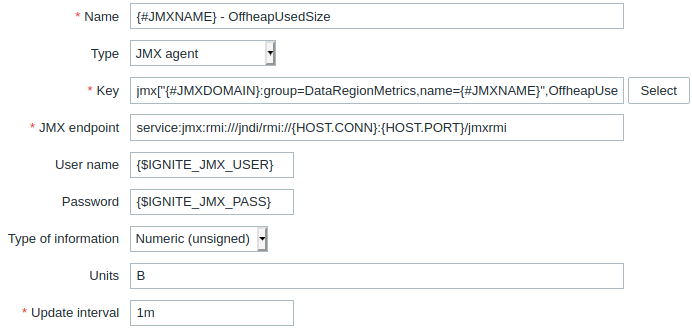
Zabbix takes the {#JMXNAME} parameter and, from the response to the discovery request, takes parameters that are similar to the {#JMXNAME} parameter.
I have identified several metric groups for which the discovery mechanism should be used:
- Data regions
- Cache groups
- Caches
- Thread pools
The rest of the metrics, such as current coordinator, the number of client and server nodes, and the number of transactions on the node, are inserted into a separate group.
Deployment and Automation
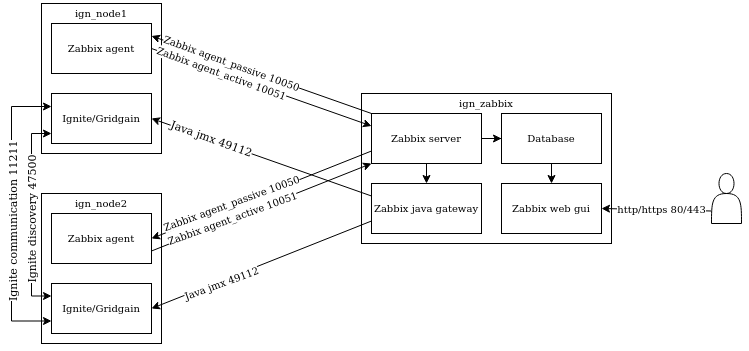
Now that we have all the necessary templates and understand how the product works, we will configure and test a monitoring system for appliances or applications. We will use Docker for process isolation.
How the process works:
- Upon receiving the first request from a Zabbix agent, the Zabbix server registers a new node.
- The Zabbix server executes a script that adds a JMX port and applies the templates to the new node.
- The Zabbix server begins sending requests to the Java gateway, which polls the application and returns metrics.
- The Zabbix agent receives a list of the active metrics that the server is collecting and begins sending the metrics to the Zabbix server.
- The Zabbix server requests the values of the metrics that are being collected passively from the Zabbix agent.
Metrics from the application are received via JMX, and new nodes are registered after the first call from the Zabbix agent to the server
Details about why a self-written script is used in step 2:
- Initially, I wanted to use Zabbix functionality, but “out-of-the-box” Zabbix does not know how to assign a JMX port to new nodes. And, without this capability, you cannot bind a template that uses JMX. A proposal for revision, which has been in Zabbix Jira since 2012, is in Open state.
- It is possible to implement this functionality via API. However, the API method requires creation of a service user, and, if you need to register a large number of nodes, it is expensive for the server.
- The option via database, which is described in the ticket from the first paragraph, is probably possible for Ppostgresql. However, the database option does not work for Oracle, MySQL, or MariDB, because, in these databases, you cannot configure a trigger that will insert something into the table on which it was triggered.
- The option of adding the interface within the script is unsuccessful, because Zabbix does not allow you to order operations at runtime. Operations are performed in the order of their creation, but the external scripts and notification sending tasks are placed into there own queue, which is processed after all other operations are complete.
How to install Ignite and Zabbix:
- If Docker and Docker Compose are not installed, download and install them.
- From the repository, download the required files.
- Go to the directory.
- Start building the image: docker-compose -f docker-compose-zabbix.yml build
- Start the cluster and the monitoring server: docker-compose -f docker-compose-zabbix.yml up
- Wait for a few seconds.
Now Zabbix is available on port 80. The default account is Admin / zabbix.
How to import templates:
- Go to Configuration->Templates->Import and, from the downloaded folder, import the zbx_export_templates.xml template. The template and the Templates/Ignite autoregistration group are added to Zabbix. And, in the future, gruop name will be used to add templates from the autoregistration group to new nodes.
- In each template that needs to be applied, specify the group that was imported in the previous step. Template file already contains the “Template App Ignite JMX” template, I have added the “Template App Generic Java JMX” and “Template OS Linux by Zabbix agent” templates.
How to create a script for agent autoregistration:
- In the Zabbix interface, go to the Configuration->Actions tab, and, from the drop-down list, select Autoregistration actions.
- Create an action.
- Name the action.
- On the tab we can also specify conditions for adding a node.
- In the operations tab, add the Add host item.
- If the conditions that were previously specified are met, this action creates a new node in Zabbix.
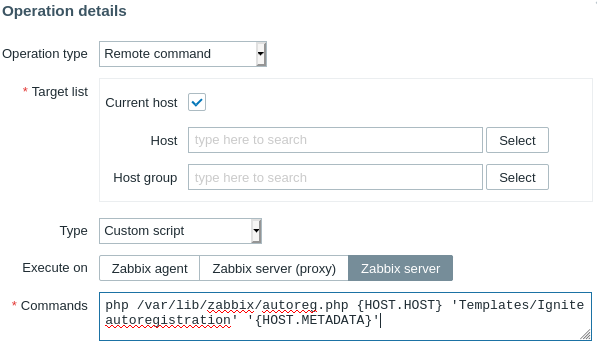
- Add the launch of the autoreg.php script.
The script adds the JMX port to the settings and applies the templates from the specified group to the passed node. For developers who deploy a test cluster from the image, it is located in the /var/lib/Zabbix folder. For developers who install Zabbix and Ignite on their own, script is located in the same repository. In my case, it runs by the command php /var/lib/zabbix/autoreg.php {HOST.HOST} 'Templates/Ignite autoregistration' '{HOST.METADATA}'. It should look like the following:
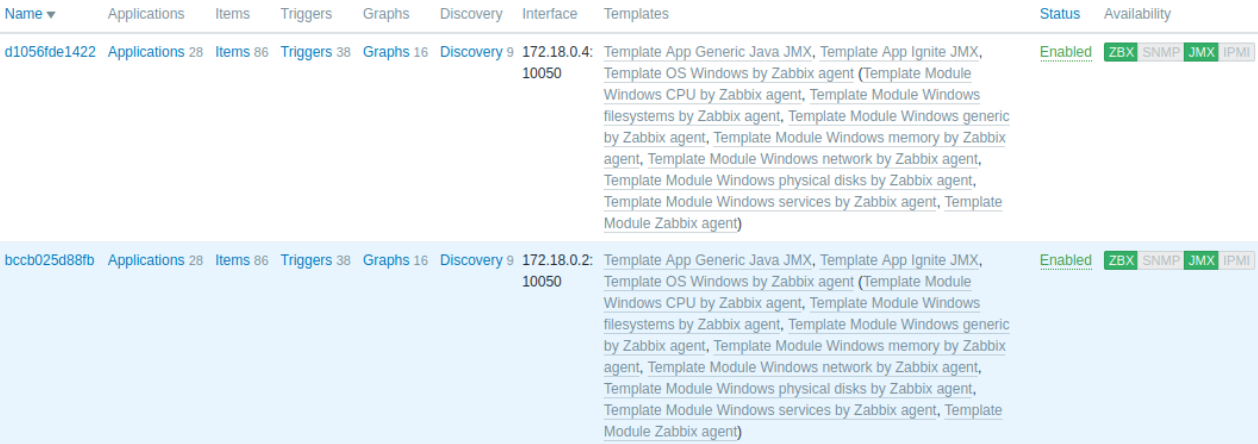
If everything was done correctly, the nodes appear in Zabbix, with the configured jmx port and the applied templates from the group. If something went wrong, check the Reports-> Audit log.
Results and Where to Go Next
When you organize monitoring, you can choose between the redundancy of the metrics and the performance of the product and monitoring system. We created a two-node cluster with monitoring that suffices for using Apache Ignite on a production cluster.
You must keep the monitoring up to date. If the current configuration is unable to prevent an emergency, you must add metrics. Also, as a best practice, you should occasionally remove unused metrics. Removals decrease the load on the monitoring system, applications, and hardware.
In addition to Apache Ignite, your solution will probably contain various other components, such as client applications, frontends, queues, network equipment, and DSS. These components also require monitoring. Without monitoring, emergency situations might not be detected in time.
For many of you, security issues are relevant. Both JMX and the Zabbix agent support the use of an SSL connection for metrics transfer. But this issue is a concern to be discussed at another time.
Ignite monitoring template based on created for this article is now available in Zabbix standard supply from version 5.4 and higher. So using Zabbix for Apache Ignite monitoring should be more convenient now.
Resources
- Site Reliability Engineering
- Zabbix documentation portal
- Out-of-the-box monitoring and control tool for Ignite and GridGain