
It has been a busy first quarter of 2021 with monthly GridGain Control Center releases. We continue to add new capabilities to help accelerate the creation and configuration of dashboards and alerts, new features for team collaboration, and new options for SQL query development.
Teams
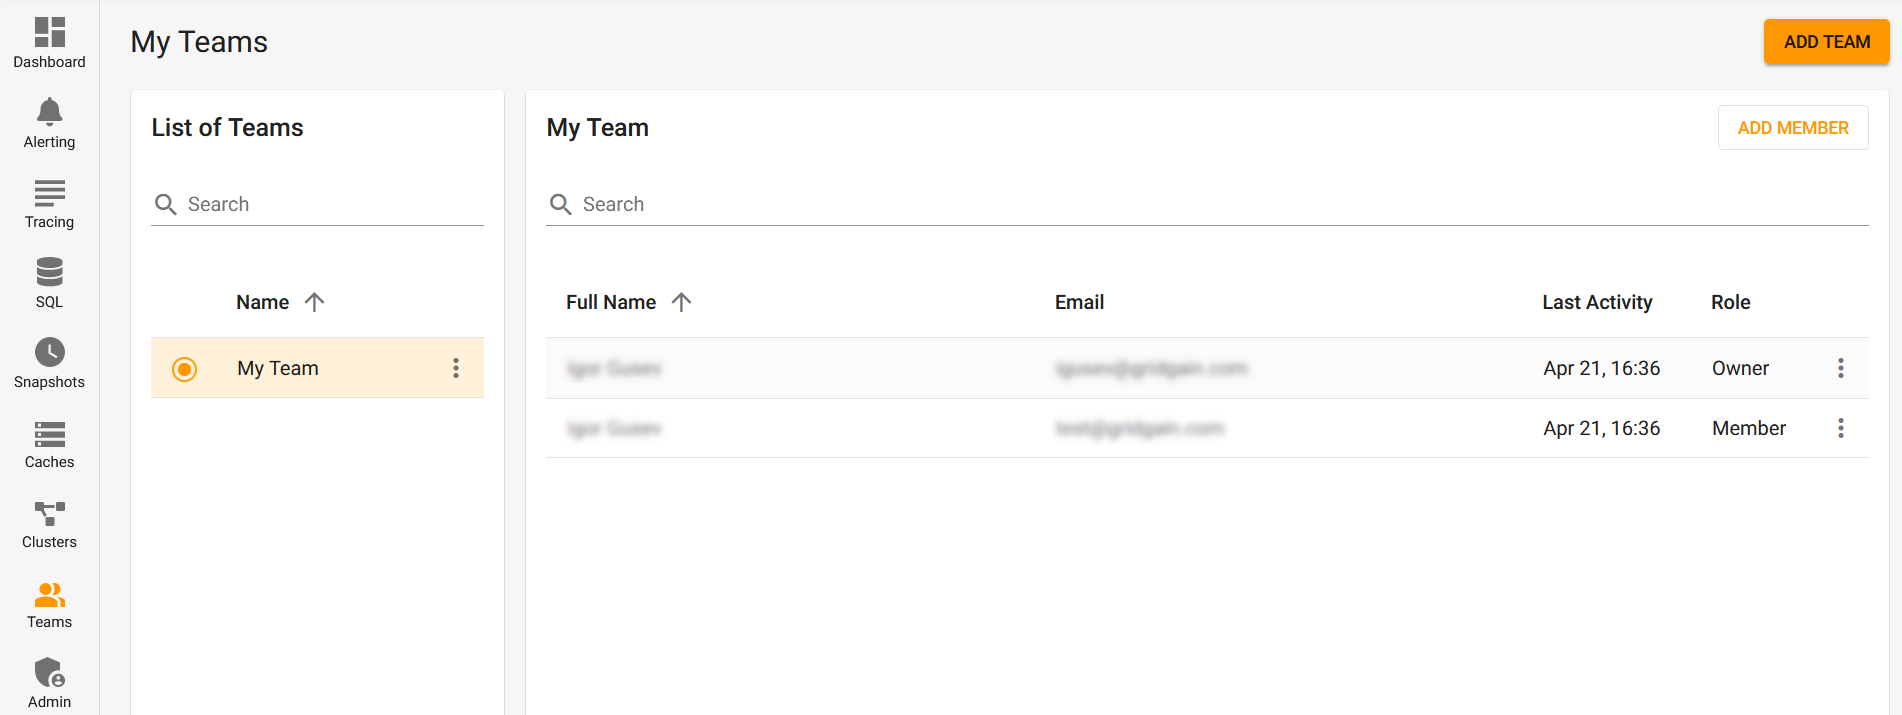
Control Center introduced a new top level feature for collaboration: Teams. In previous releases, Control Center has been more or less a single user experience. Cluster connections, SQL queries, Traces, etc have all been specific to the logged in user account but what happens when multiple Admins or Developers want to work with a cluster? Each dashboard, query, or alert needs to be recreated for each user account.
The new Teams feature enables a group of users to form a team and share their configuration resources. For this first release, sharing is limited to the Cluster connection. With a shared cluster, team members can then create their own individual artifacts like dashboards, alerts, queries, etc. Over time we will add sharing for additional artifacts so that a team could have a set of common dashboards or common queries.
Metrics selection and search
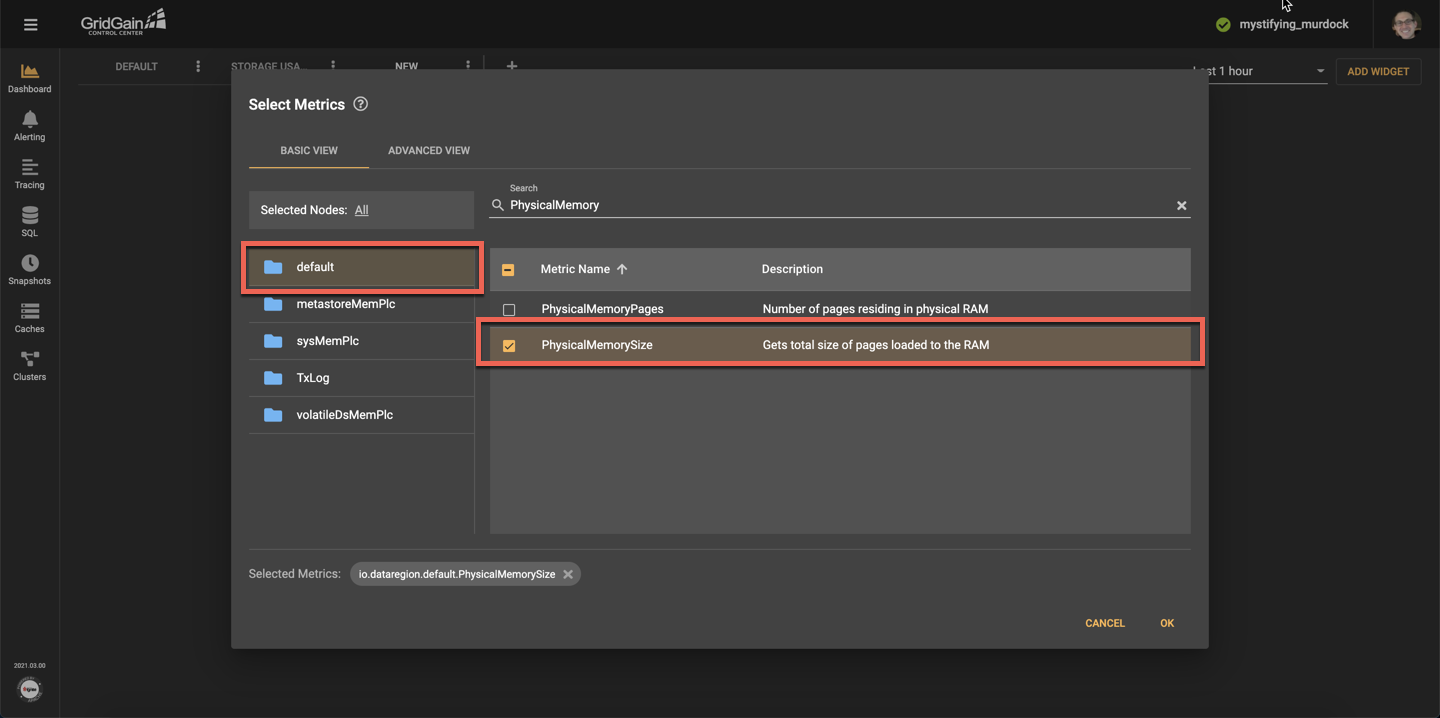
GridGain and Ignite clusters have hundreds of metrics available to monitor and analyze and, in our initial release of Control Center, we categorized metrics into three scopes; Cluster, Node, and Cache. This proved to be insufficient as users found it difficult to locate the appropriate metrics for other categories like transactions, threading, or data storage.
We recently redesigned the metrics selection with a basic interface that adds many more categories along with more detailed descriptions for the individual metrics. This makes it easier to search for the metrics that are important for your use case or to browse and learn about the metrics available in Ignite and GridGain.
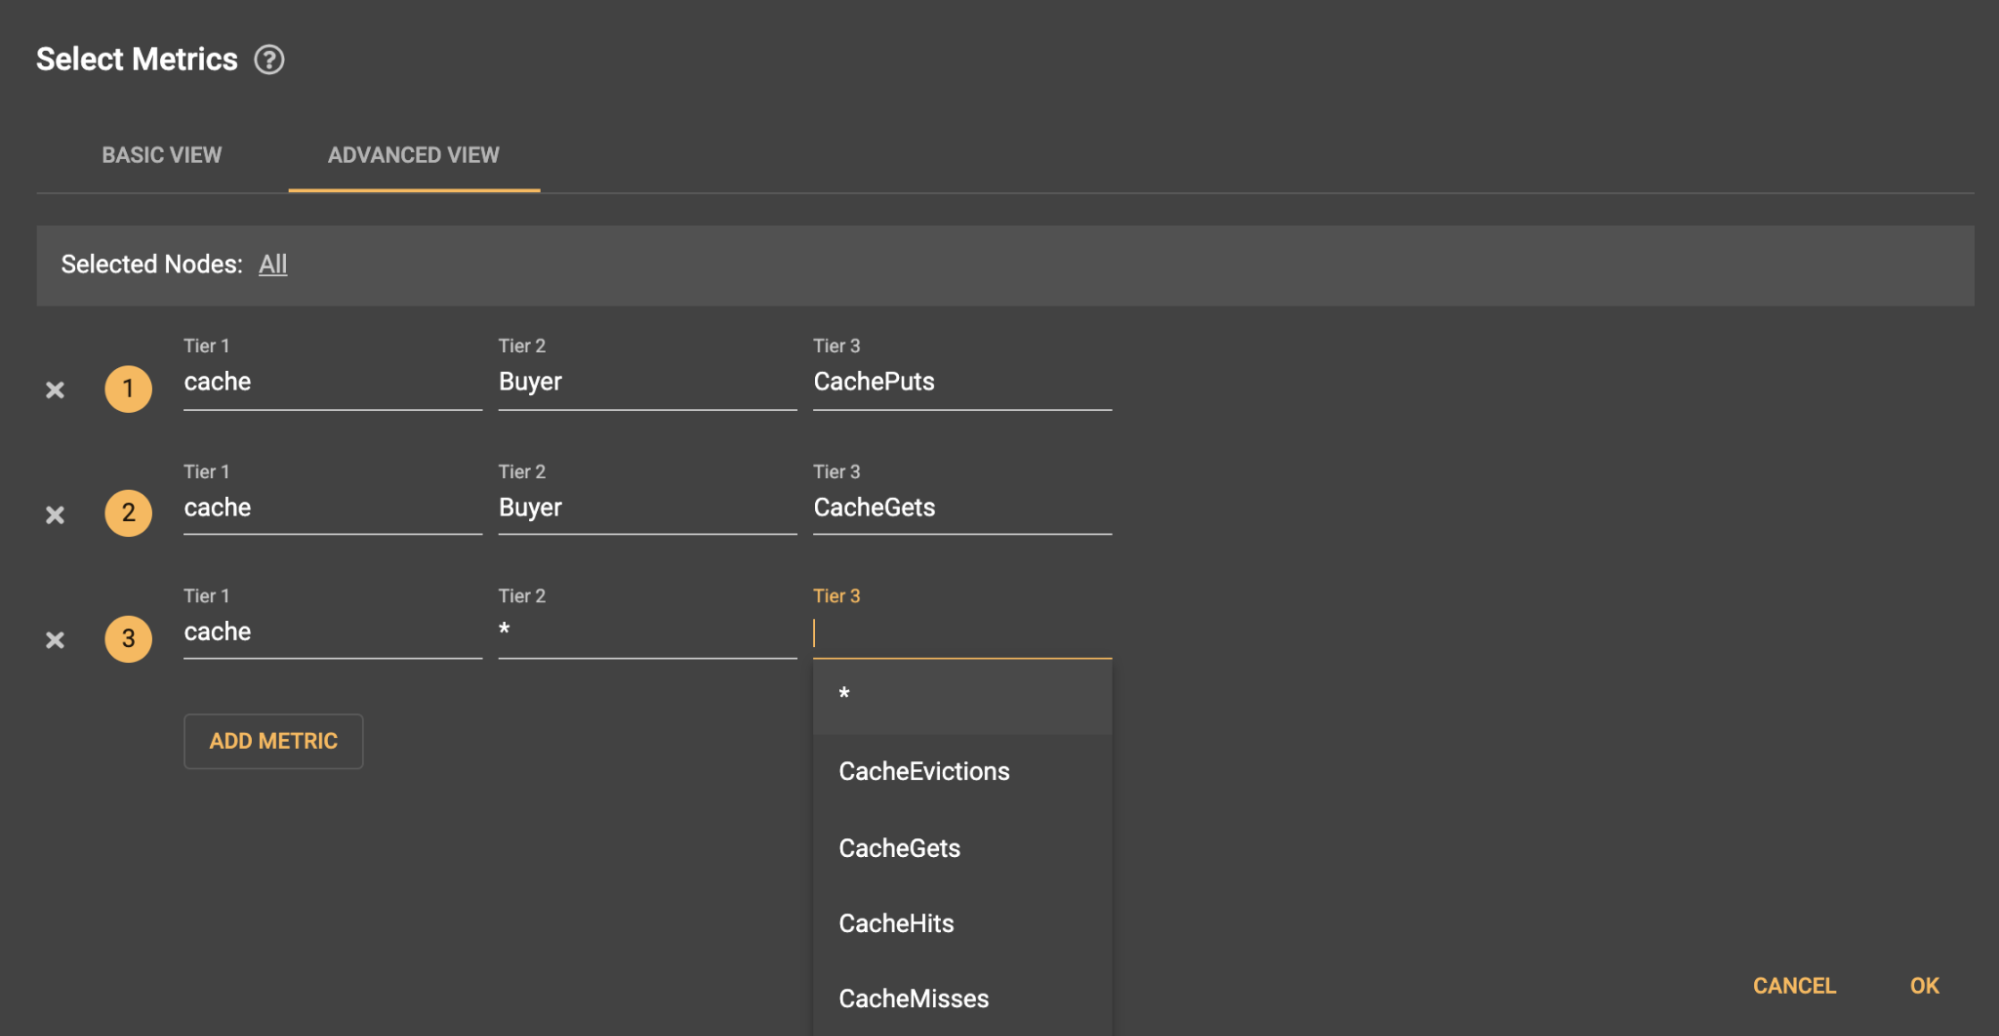
We also created an Advanced View which you can use to navigate the metrics hierarchy and supports wildcard searches. The advanced search with wildcards makes it easy to pull multiple metrics into a widget quickly. For example, you may want to compare the get and put metrics from a group of caches in a table. Using Advanced search, this only takes a few clicks.
For more details on the design process that went into these improvements check out this blog from Stanislav Shusharin, our UX designer.
Multi-metric Charts
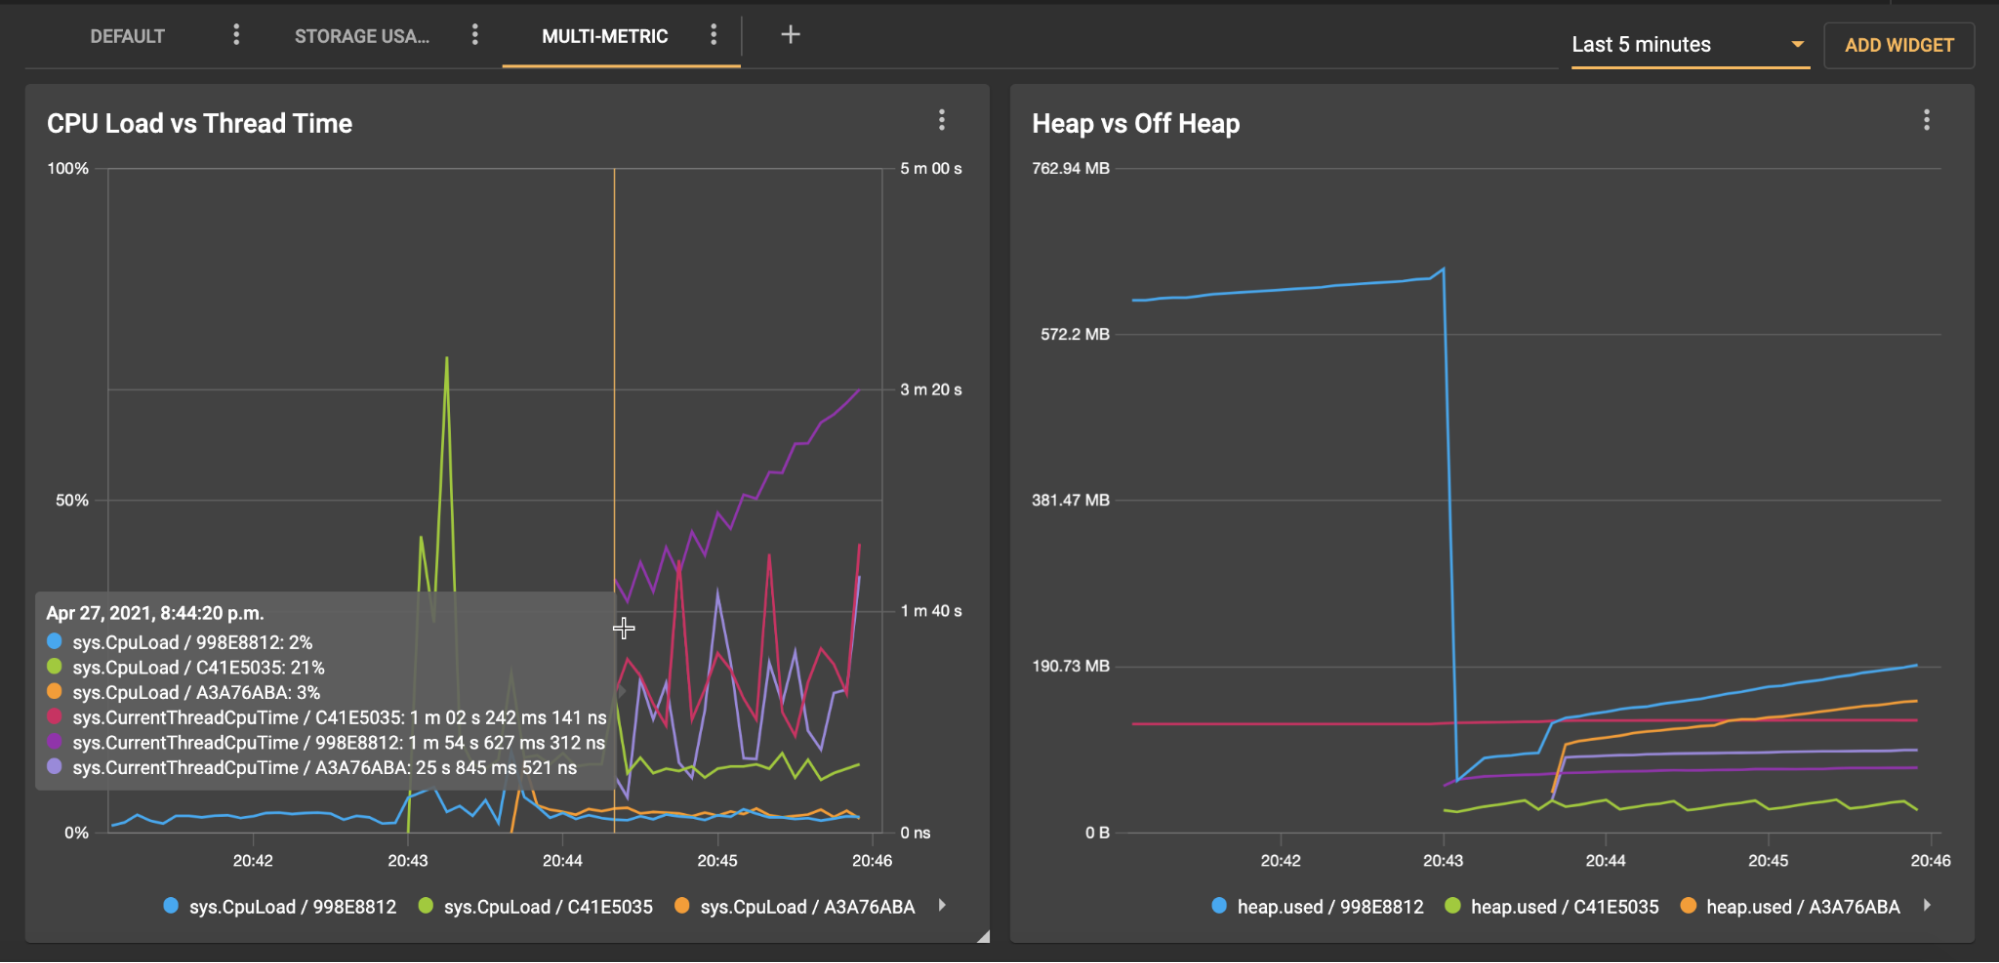
When building custom dashboards, you may want to compare multiple values in a graph such as comparing Heap vs Off Heap memory consumption. The graph widgets have been improved to display multiple metrics and can even support metric comparisons that use different metrics units. In the below example, we compare CPU Usage (% based) with the CPU thread times (time based). This additional flexibility gives you more ways to display, track, and compare important data points from your applications.
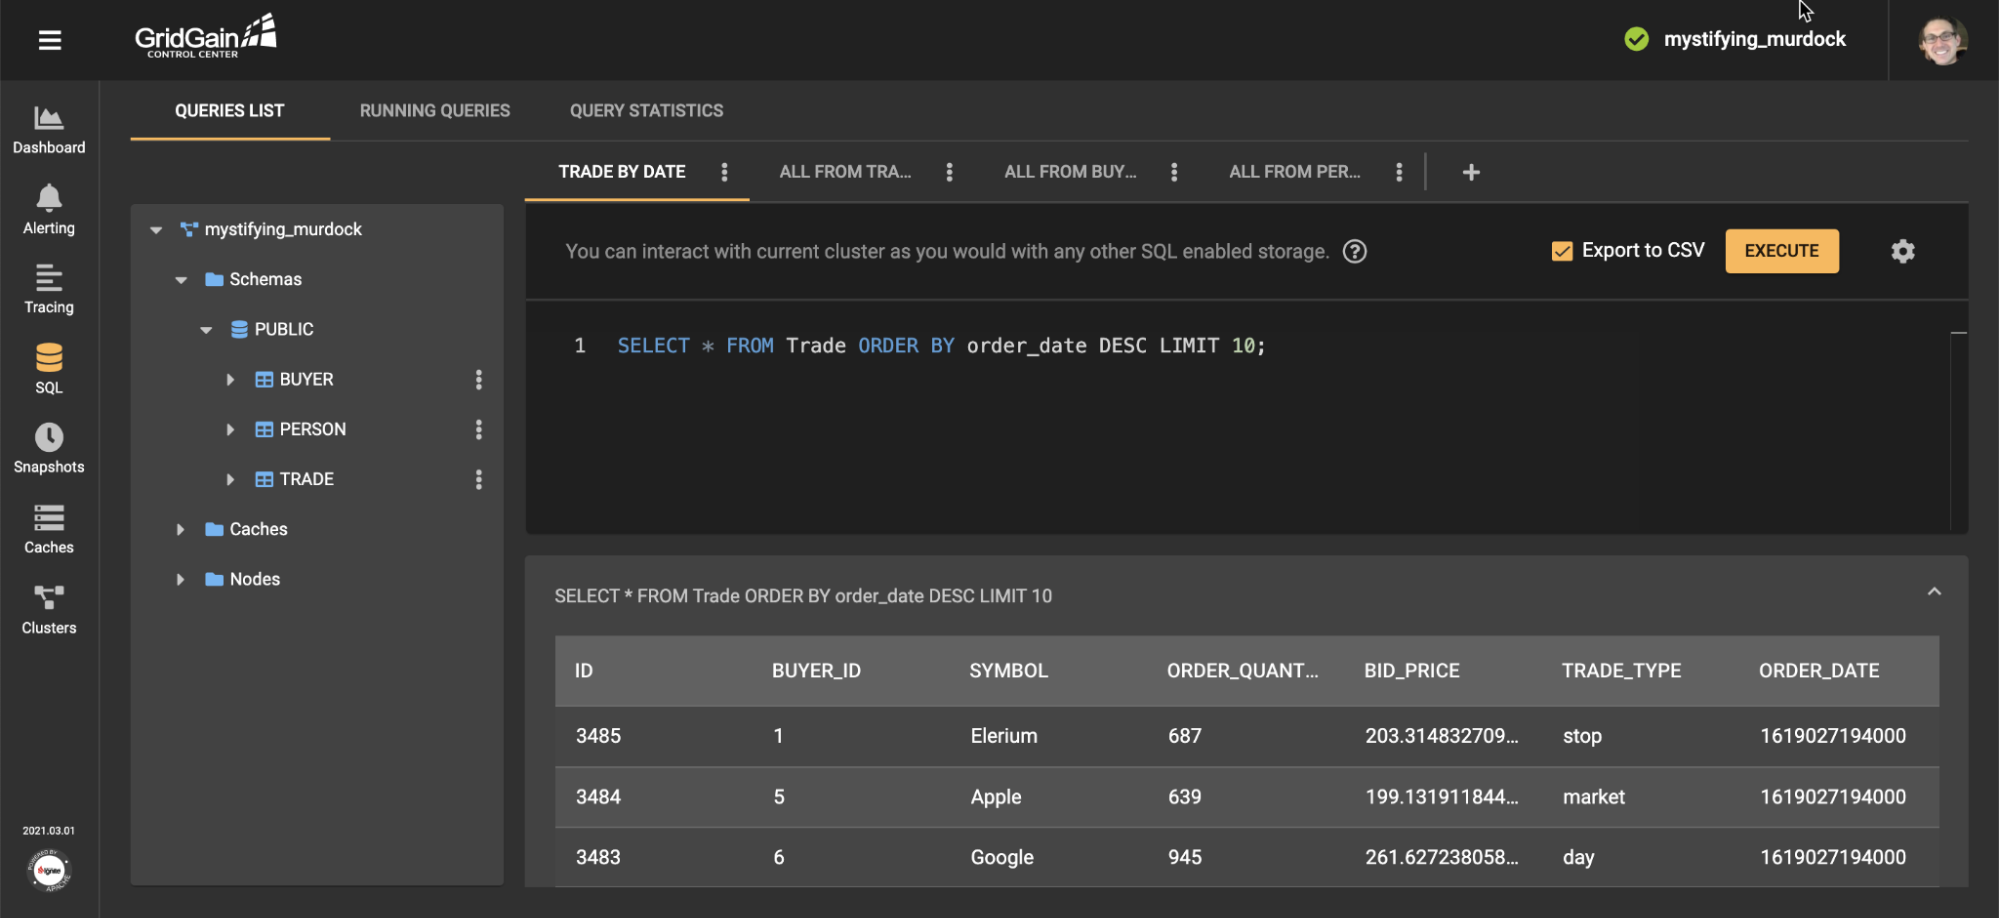
SQL Export
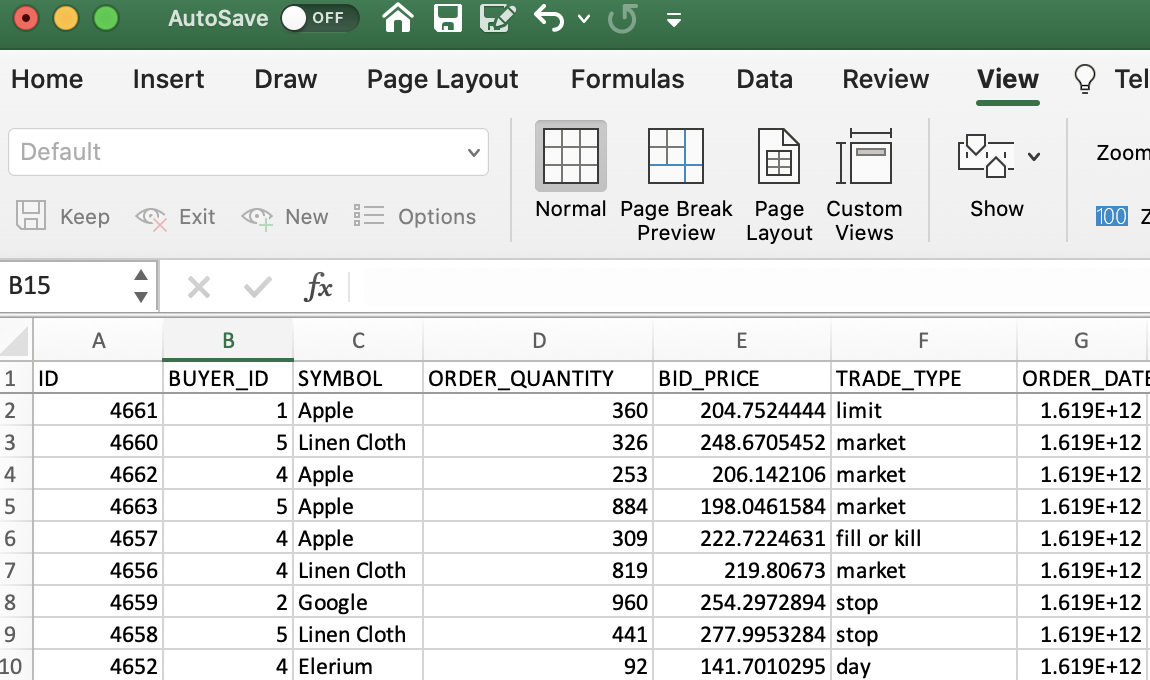
When developing and testing SQL Queries, users have asked to be able to export the result set data into a downloadable format. A new option in the SQL editor can now generate a .csv of the data which can be downloaded from Control Center.
The downloaded query data can then be imported and used in other tools for additional analysis.
The Control Center software is available as a hosted version or as a downloadable version. To get started sign up for the hosted version or download the on-prem version.